Fig. 4
Download original image
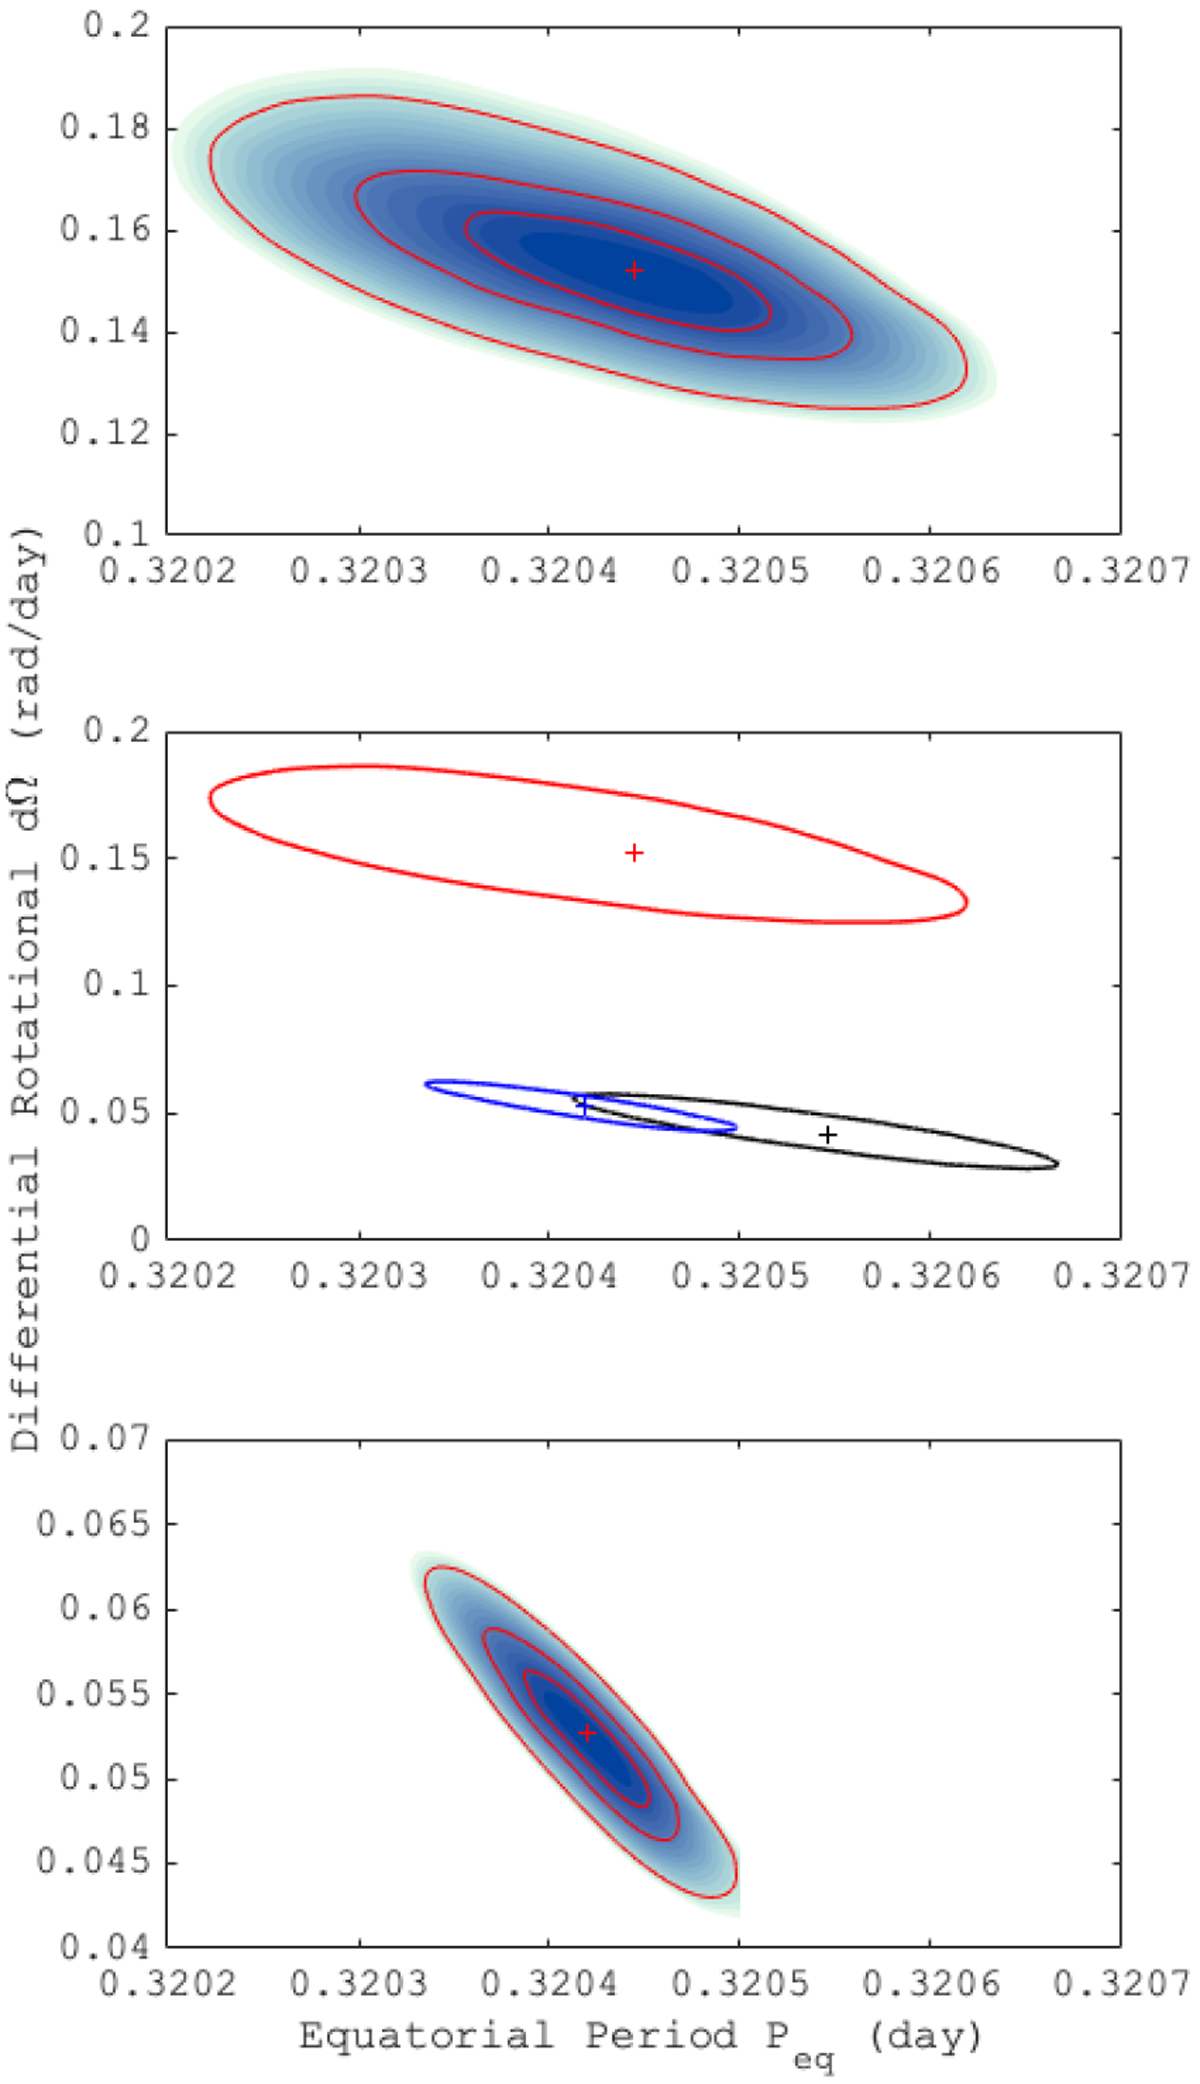
Reduced χ2 maps for the equatorial rotational period Ωeq and differential rotation dΩ for Stokes I (bottom panel) & Stokes V data (top panel). The three, red solid lines illustrate the 1, 2, and 3σ confidence intervals. Middle panel: a comparison of 3σ regions for Stokes I in 2018 (blue), Stokes I in 2006 (black), and Stokes V (red). Crosses mark the location of peak values.
Current usage metrics show cumulative count of Article Views (full-text article views including HTML views, PDF and ePub downloads, according to the available data) and Abstracts Views on Vision4Press platform.
Data correspond to usage on the plateform after 2015. The current usage metrics is available 48-96 hours after online publication and is updated daily on week days.
Initial download of the metrics may take a while.