Fig. 3
Download original image
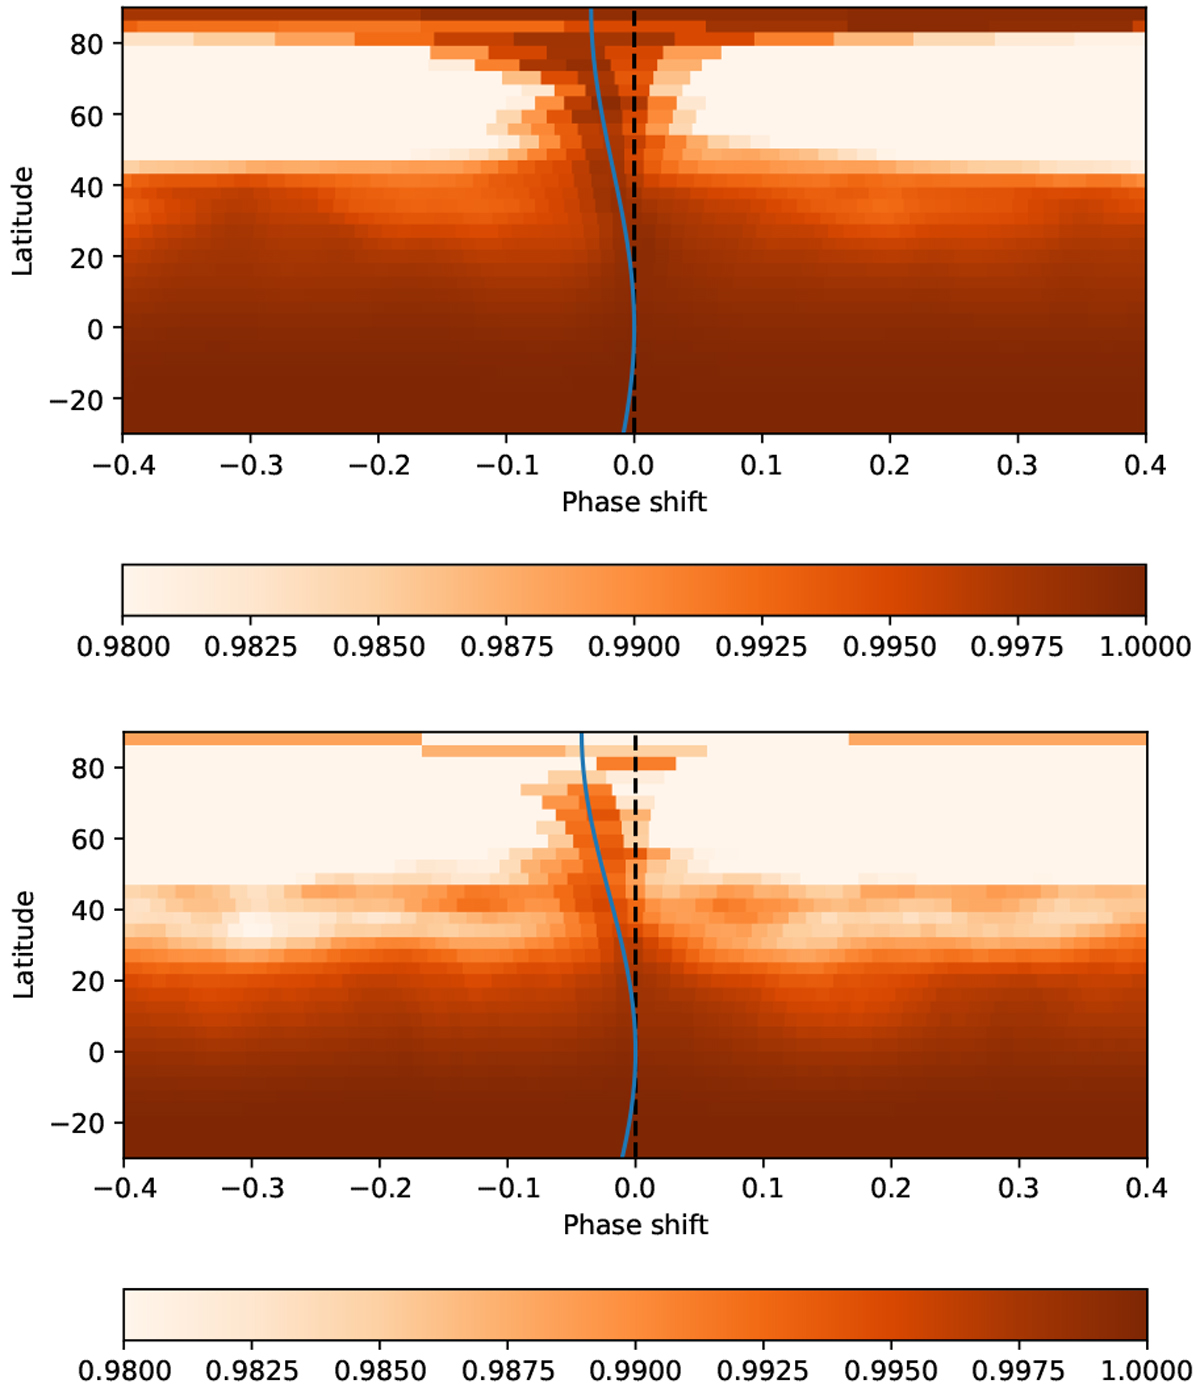
Top: cross-correlation map obtained by comparing two brightness maps obtained using 2018 data from 18 Oct., versus 23 Oct. (with a gap of 15.6 rotation periods between the two maps). Bottom: same, but for the two observing nights of our 2006 data (18.7 rotation periods apart). The blue lines show the differential rotational law derived using the sheared imaged method in Sect. 4 (top panel), and in C20 (bottom panel). The black, dashed line marks a null phase shift (which is equivalent to a solid-body rotation).
Current usage metrics show cumulative count of Article Views (full-text article views including HTML views, PDF and ePub downloads, according to the available data) and Abstracts Views on Vision4Press platform.
Data correspond to usage on the plateform after 2015. The current usage metrics is available 48-96 hours after online publication and is updated daily on week days.
Initial download of the metrics may take a while.