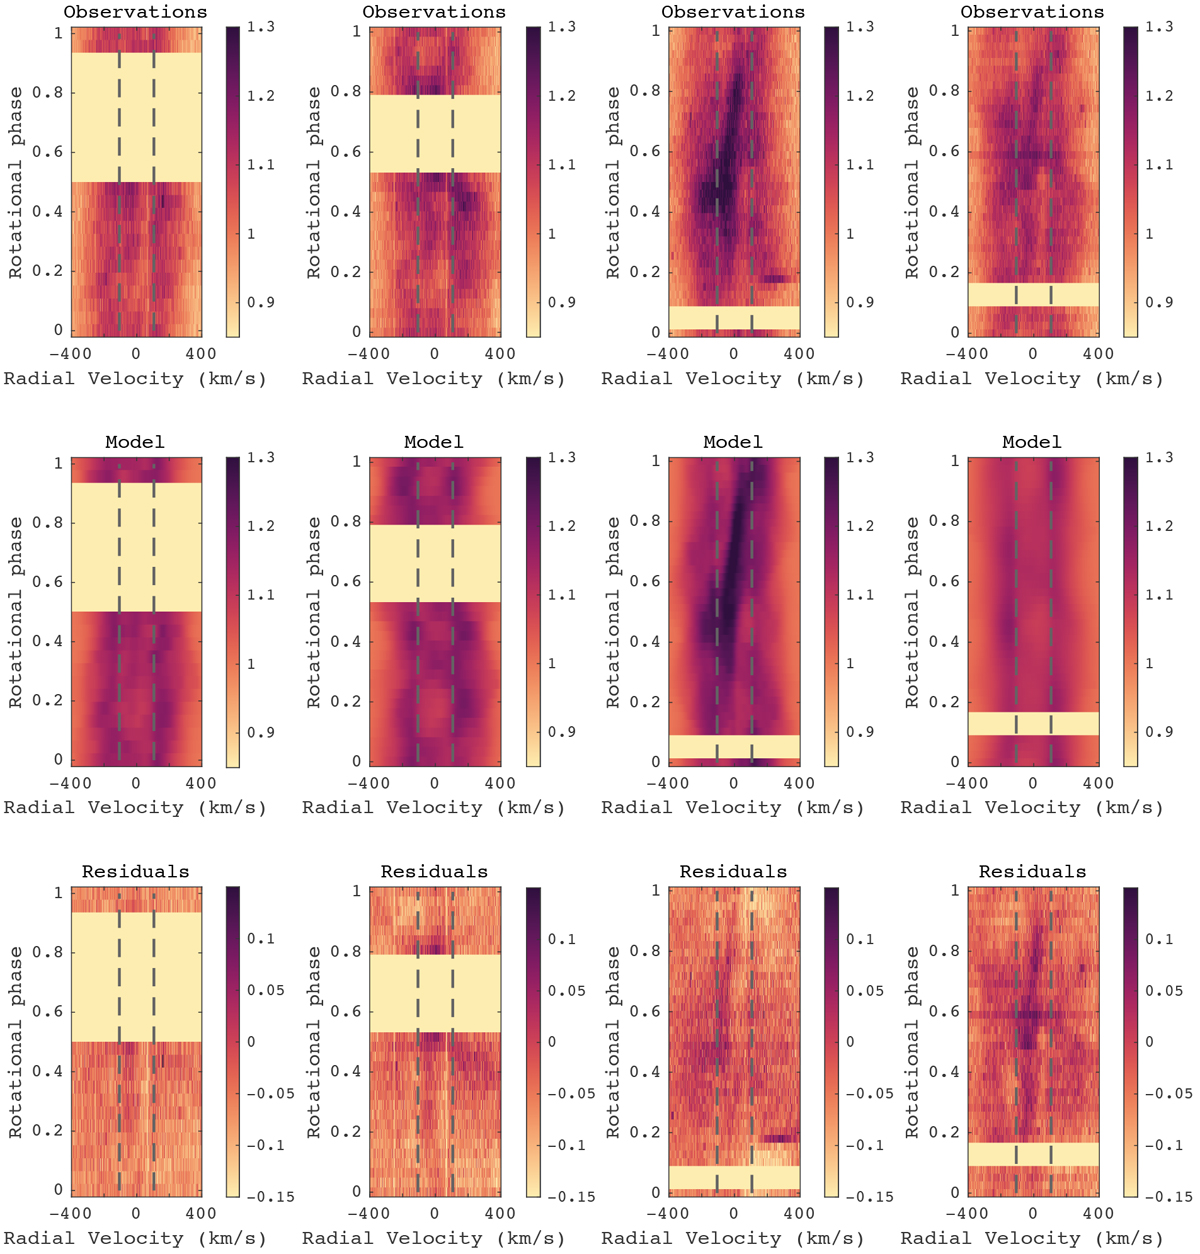
Fig. F.1
Download original image
Dynamic spectra for Hα, including the observations (Top), the tomography models (Middle), the residuals between observation and model (Bottom). From left to right, the figure shows the data of 17, 18, 22, 23 Oct 2018, with color scale according to the normalized flux. Rotational phases are computed according to Eq. 1. Vertical dashed lines show the position of ± v sini.
Current usage metrics show cumulative count of Article Views (full-text article views including HTML views, PDF and ePub downloads, according to the available data) and Abstracts Views on Vision4Press platform.
Data correspond to usage on the plateform after 2015. The current usage metrics is available 48-96 hours after online publication and is updated daily on week days.
Initial download of the metrics may take a while.