Open Access
Fig. D.1
Download original image
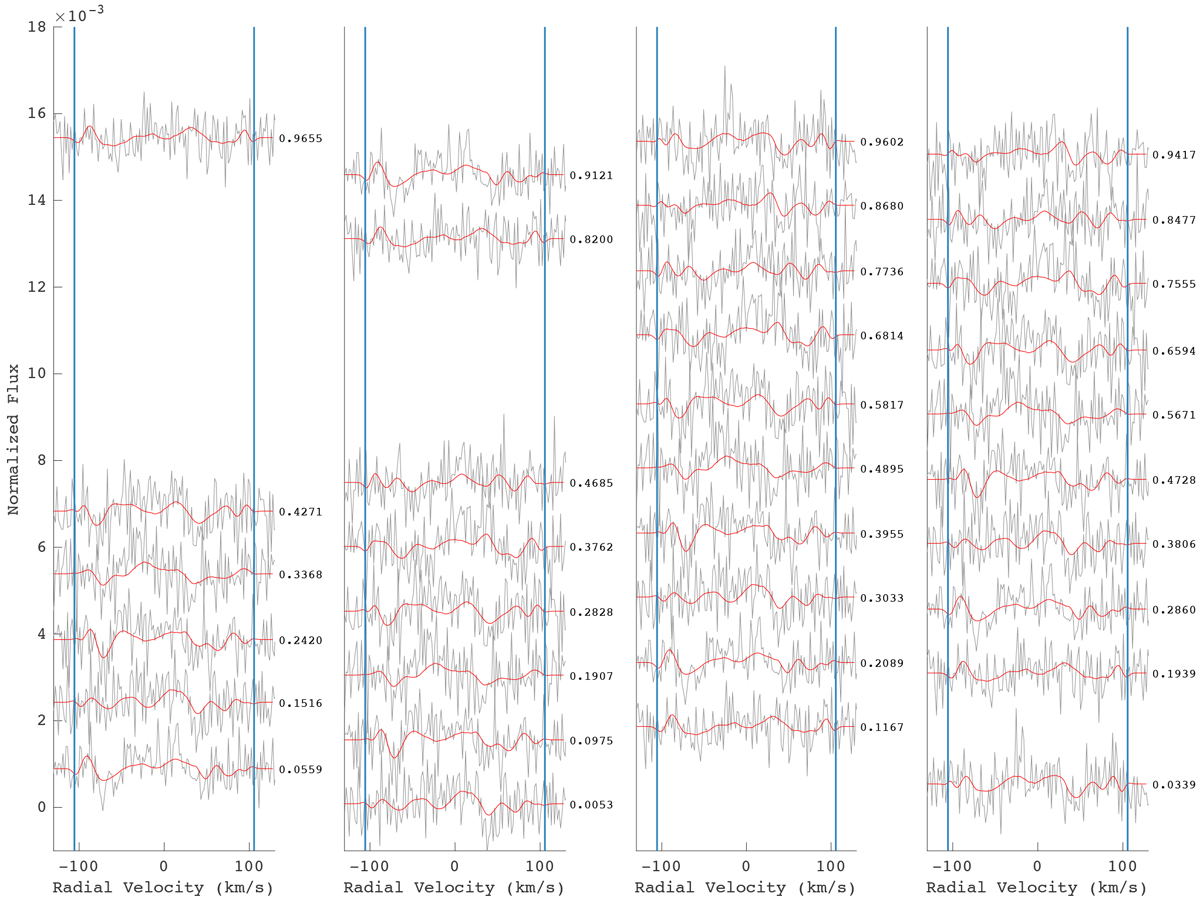
Observed (black) and synthetic (red) Stokes V profiles. The subpanels from left to right show data of the 17, 18, 22, and 23 Oct, respectively. Blue vertical lines mark the ± v sini limit. Rotational phases are indicated on the right side of each panel, next to the corresponding profile.
Current usage metrics show cumulative count of Article Views (full-text article views including HTML views, PDF and ePub downloads, according to the available data) and Abstracts Views on Vision4Press platform.
Data correspond to usage on the plateform after 2015. The current usage metrics is available 48-96 hours after online publication and is updated daily on week days.
Initial download of the metrics may take a while.