Fig. 1
Download original image
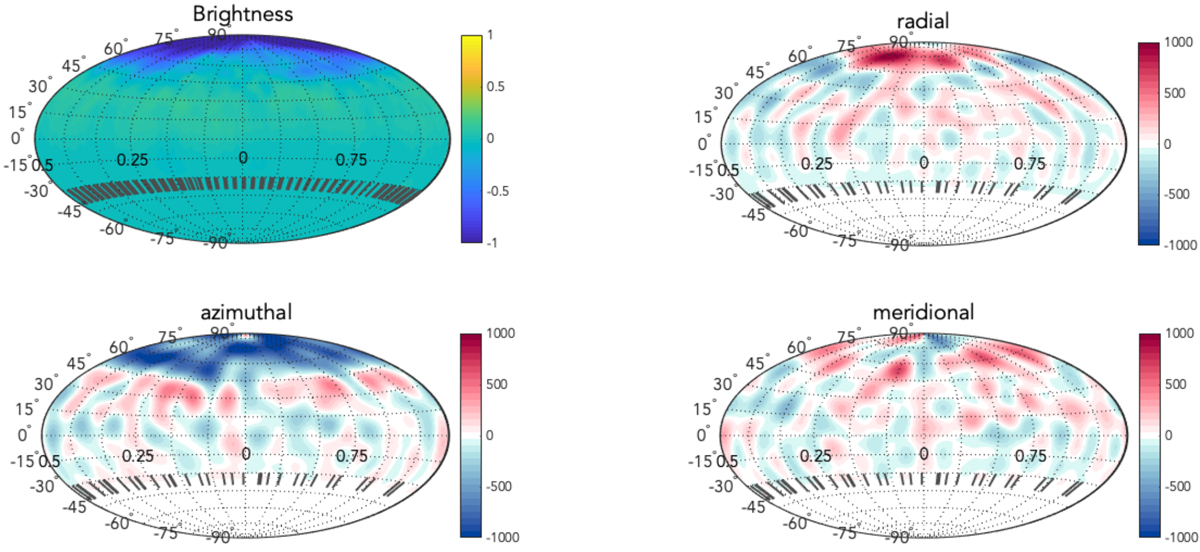
Reconstructed brightness and magnetic field maps of V530 Per in 2018. Top-left: logarithmic brightness (normalized to the nonspotted brightness). For the sake of clarity, the Hammer projection was adopted and the gravitydarkening was subtracted. Top-right, bottom-left, and bottom-right: radial, azimuthal, and meridional components of the magnetic field. The color scale illustrates the field strength, in Gauss. Meridional ticks at the bottom of the maps mark the rotational phases of our observations. The portion of the map below −40° of latitude is set to 0, as it is invisible to the observer. A polar view of the same maps can be found in Fig. G.1.
Current usage metrics show cumulative count of Article Views (full-text article views including HTML views, PDF and ePub downloads, according to the available data) and Abstracts Views on Vision4Press platform.
Data correspond to usage on the plateform after 2015. The current usage metrics is available 48-96 hours after online publication and is updated daily on week days.
Initial download of the metrics may take a while.