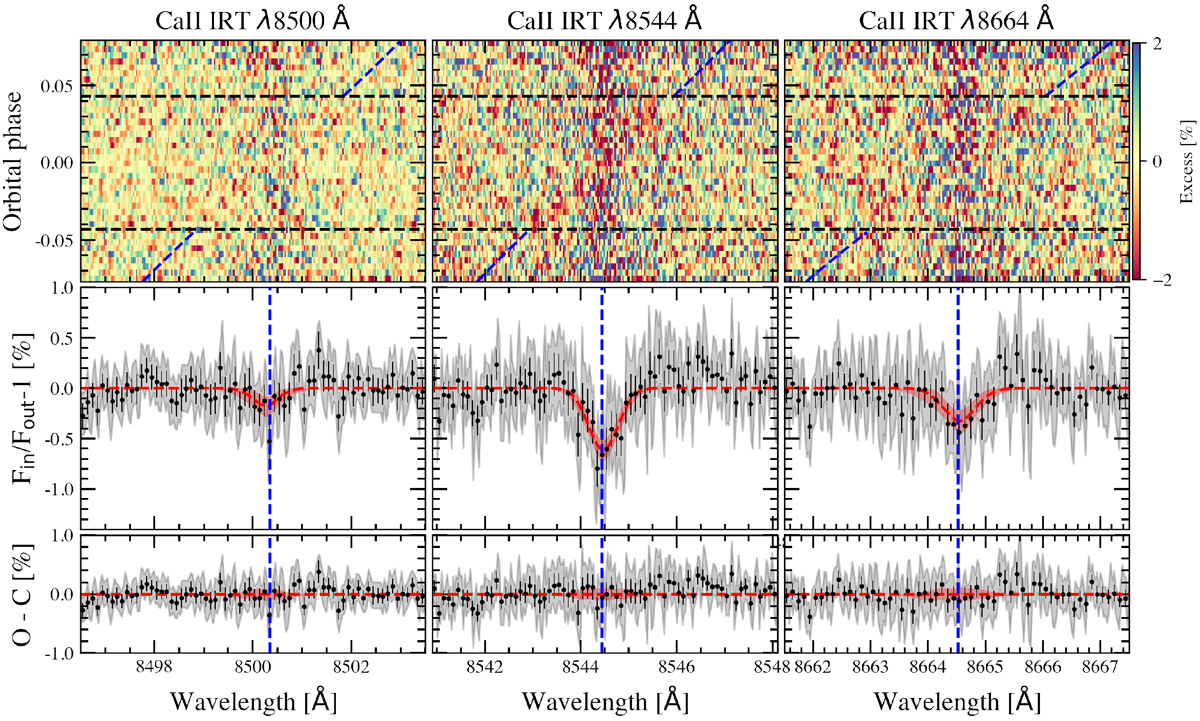
Fig. 8
Download original image
Transmission spectra obtained around the three lines of the Ca II IRT triplet, as a result of combining the two nights. Top panels: tomography maps shown in the stellar rest frame. The orbital phase of the planet is presented in the vertical axis, the wavelength (in vacuum) in the horizontal axis, and the flux excess information is shown in the colour bar (in %). The data are shown binned by 0.004 in orbital phase. The tilted blue-dashed lines show the position of the spectral lines in the planet rest frame. The black-dashed lines show the first and last contact of the transit (ϕ = ±0.043; Ehrenreich et al. 2020). Middle panels: transmission spectra computed considering the data between the first and last contacts of the transit. In light grey, we show the uncertainties of the original data sampling, and in black the data binned by 0.1Å. The blue-dashed lines show the laboratory wavelengths of the lines, the red-dashed line the best-fit Gaussian profile, and the light red regions indicate the 1σ uncertainties of the profiles. Bottom panels: residuals between the observed transmission spectra and the best-fit Gaussian profiles shown in the middle panel.
Current usage metrics show cumulative count of Article Views (full-text article views including HTML views, PDF and ePub downloads, according to the available data) and Abstracts Views on Vision4Press platform.
Data correspond to usage on the plateform after 2015. The current usage metrics is available 48-96 hours after online publication and is updated daily on week days.
Initial download of the metrics may take a while.