Fig. 7
Download original image
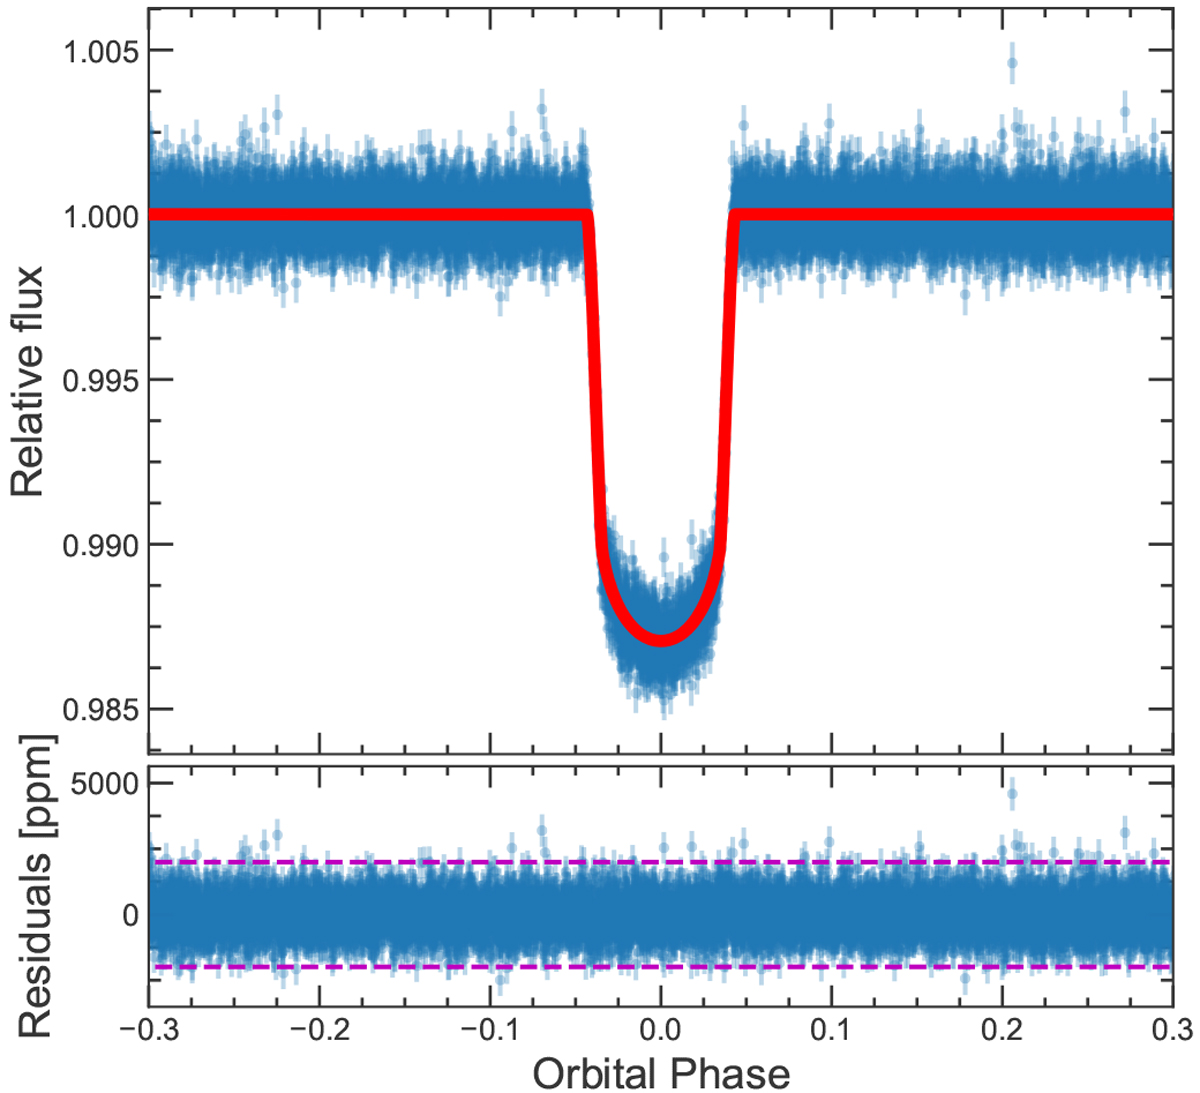
Top panel: TESS phase-folded light curve centred on the transit of WASP-76b. The red line shows the best-fit transit model. Bottom panel: residuals between the phase-folded light curve and the best-fit model. The magenta dashed lines depict the residual standard deviation multiplied by three, which points to no significant anomalies inside the transits in comparison to the points out of transit.
Current usage metrics show cumulative count of Article Views (full-text article views including HTML views, PDF and ePub downloads, according to the available data) and Abstracts Views on Vision4Press platform.
Data correspond to usage on the plateform after 2015. The current usage metrics is available 48-96 hours after online publication and is updated daily on week days.
Initial download of the metrics may take a while.