Free Access
Fig. 5
Download original image
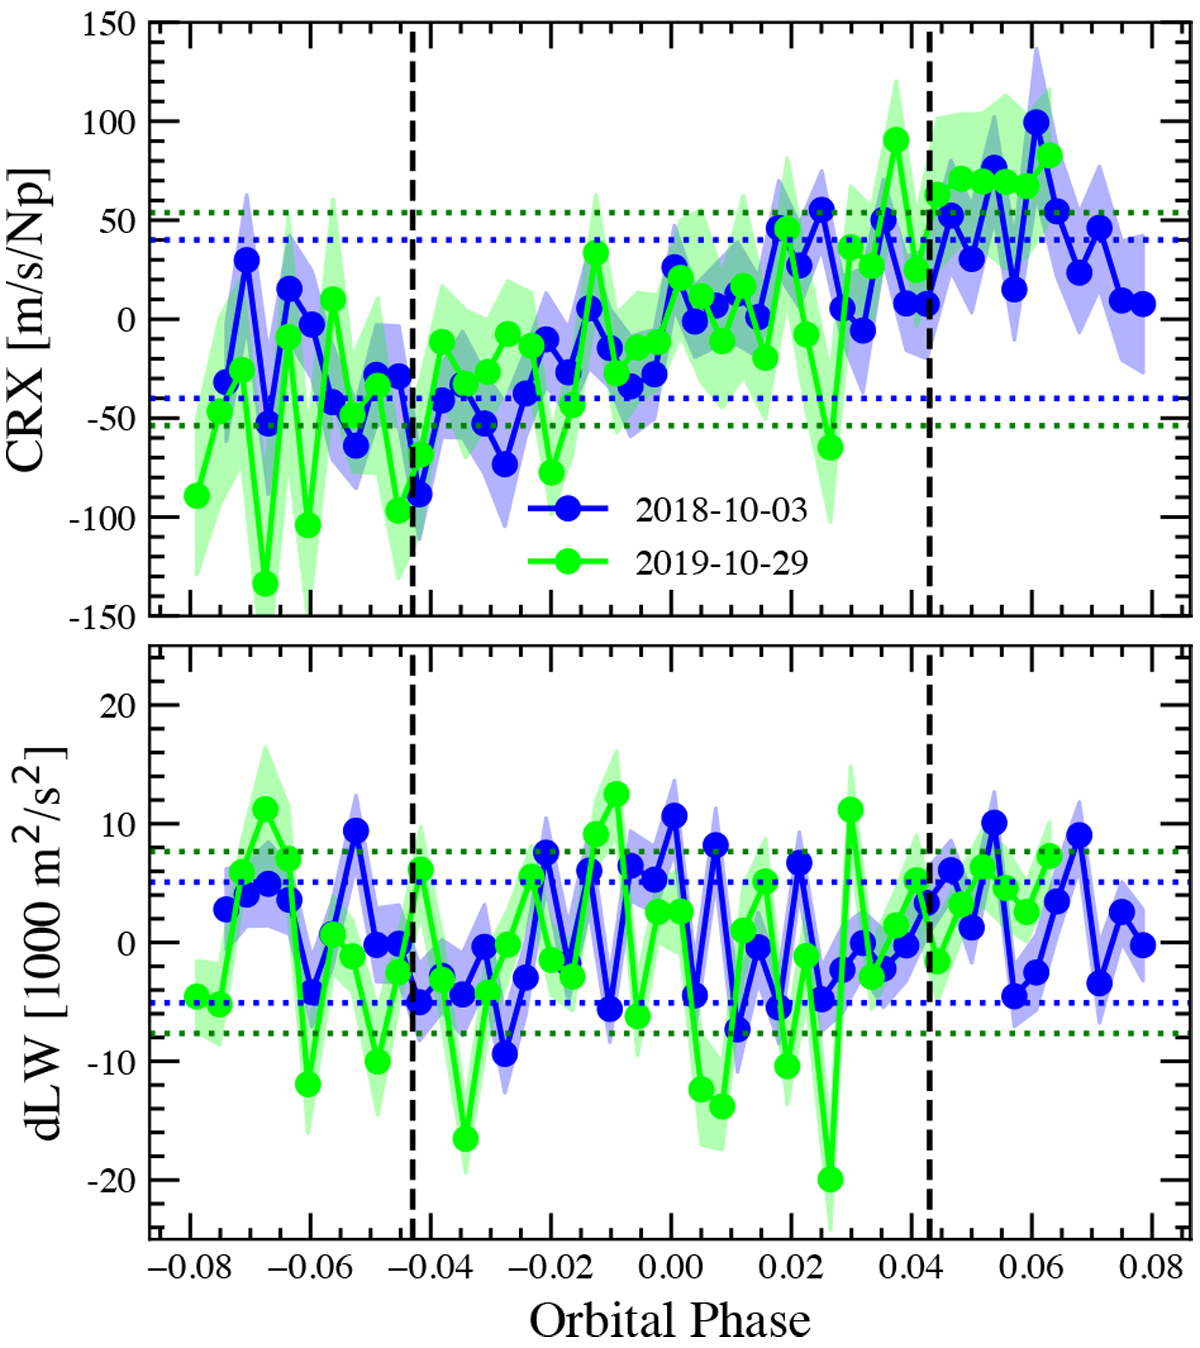
Activity indices derived with serval for the two observing nights, shown in blue and green lines, respectively. Top panel: chromatic radial-velocity index (CRX). Bottom panel: differential line width (dLW). The horizontal dotted lines show the standard deviation of the values for the first (blue) and second night (green).
Current usage metrics show cumulative count of Article Views (full-text article views including HTML views, PDF and ePub downloads, according to the available data) and Abstracts Views on Vision4Press platform.
Data correspond to usage on the plateform after 2015. The current usage metrics is available 48-96 hours after online publication and is updated daily on week days.
Initial download of the metrics may take a while.