Fig. 3
Download original image
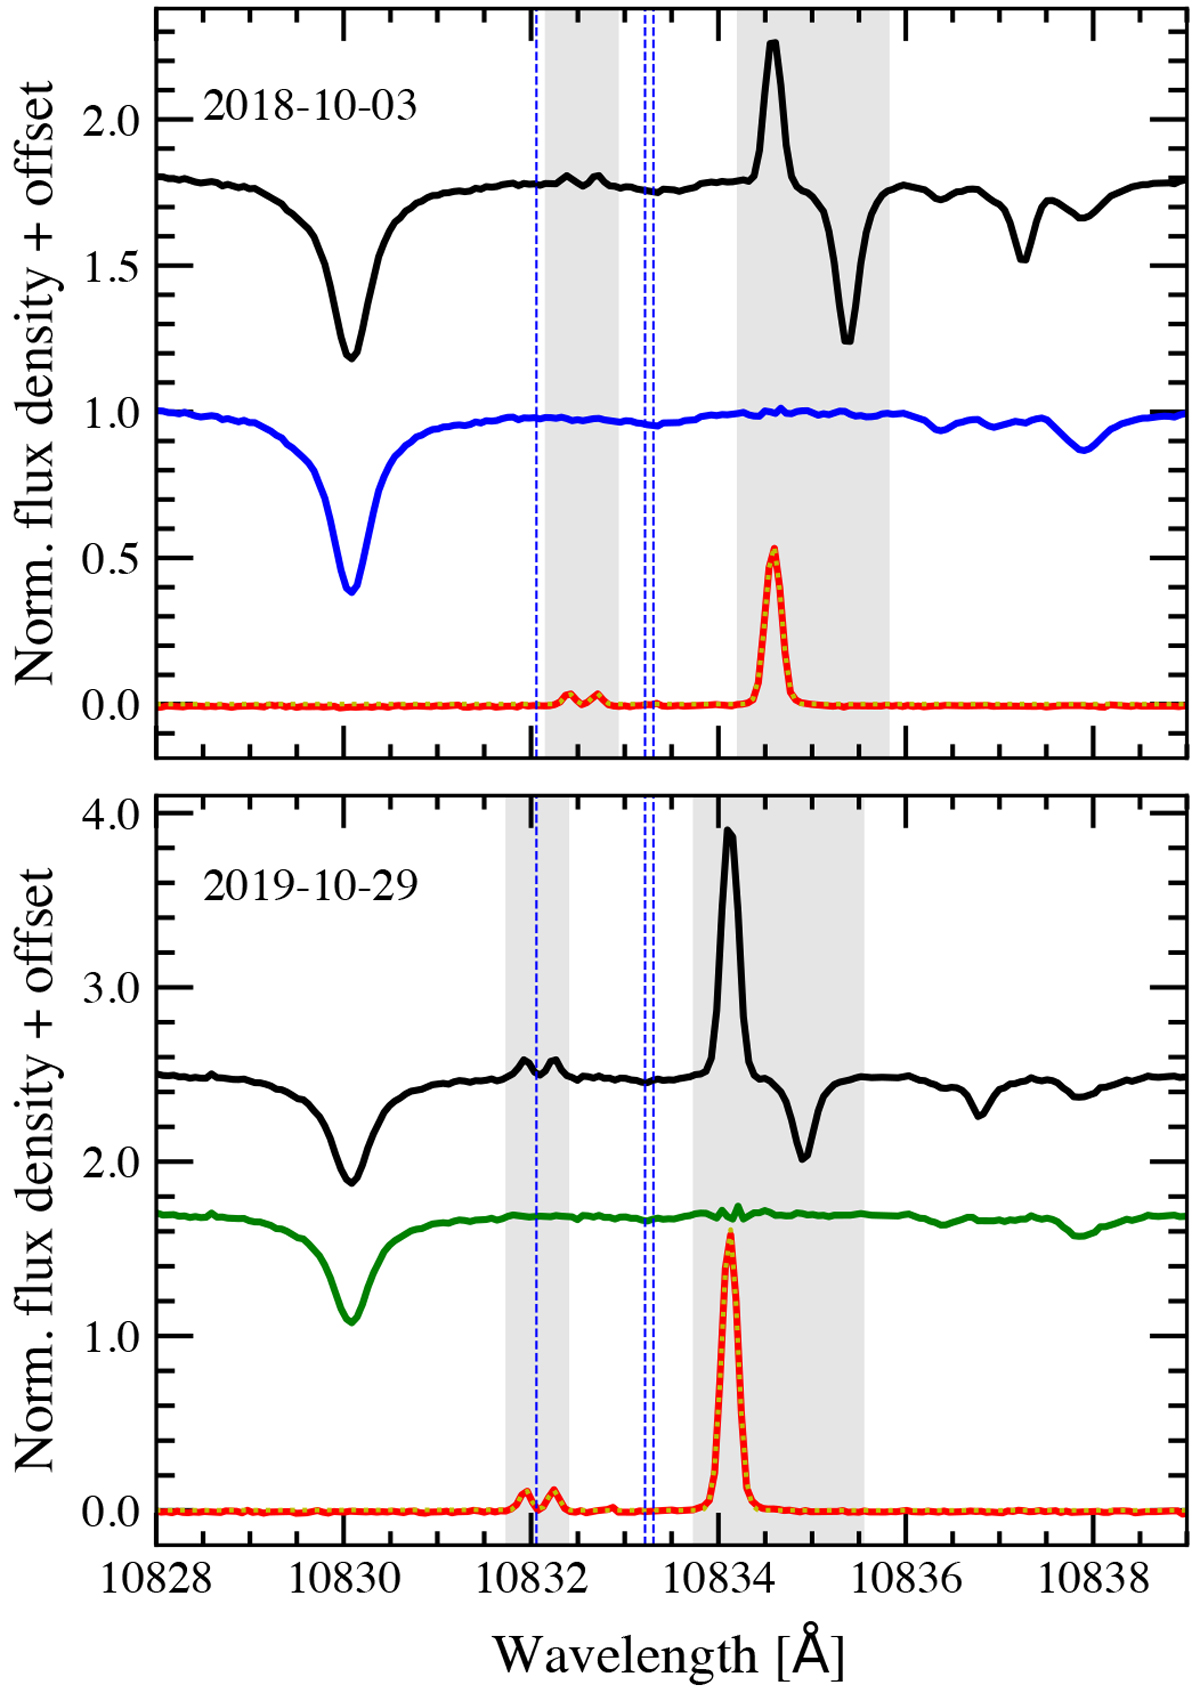
Combined out-of-transit observations around the He I triplet lines for the first (top panel) and second (bottom panel) nights in the stellar rest frame. The observed stellar spectrum (fibre A) is shown in black and the telluric-absorption-corrected spectrum in blue (first night) and green (second night). The sky spectrum (fibre B) is presented inred, and the best fit profile in yellow dots. In light grey we indicate the regions that were masked due to telluric contamination (see details in Sect. 4.1.2), and the vertical blue-dashed lines mark the positions of the He I triplet lines.
Current usage metrics show cumulative count of Article Views (full-text article views including HTML views, PDF and ePub downloads, according to the available data) and Abstracts Views on Vision4Press platform.
Data correspond to usage on the plateform after 2015. The current usage metrics is available 48-96 hours after online publication and is updated daily on week days.
Initial download of the metrics may take a while.