Fig. A.6
Download original image
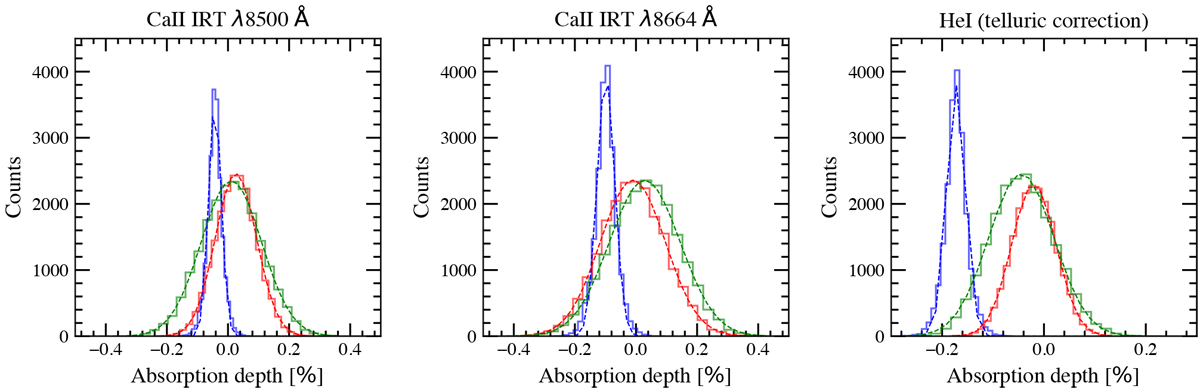
EMC distributions around the Ca II IRT lines at 8500 Å and 8664 Å, and the He I lines, for both nights combined. The distributions are obtained using 20 000 iterations and a 2Å bandwidth for the Ca II IRT lines and 5Å bandwidth for the He I, to cover the overall absorption feature observed in the transmission spectrum. The results of the ‘in-in’ sample are shown in red, the ‘out-out’ in green, and the ‘in-out’ in blue. The dashed lines show the best-fit Gaussian profiles of the distributions.
Current usage metrics show cumulative count of Article Views (full-text article views including HTML views, PDF and ePub downloads, according to the available data) and Abstracts Views on Vision4Press platform.
Data correspond to usage on the plateform after 2015. The current usage metrics is available 48-96 hours after online publication and is updated daily on week days.
Initial download of the metrics may take a while.