Fig. 2
Download original image
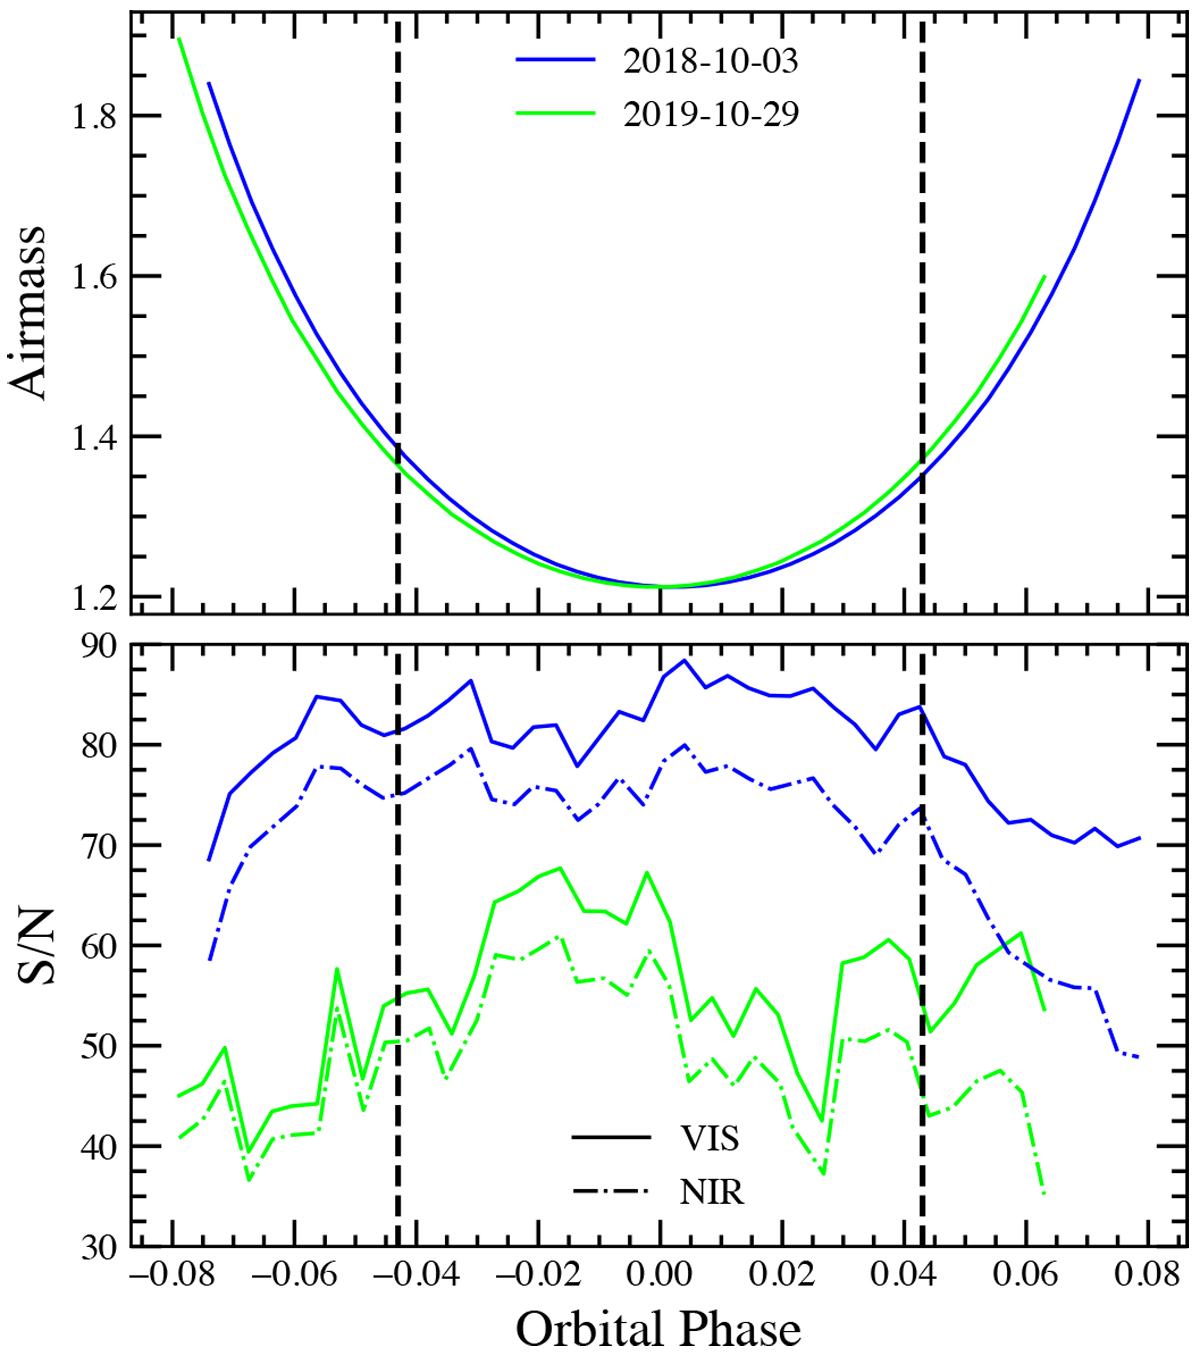
Evolution of the airmass (top panel) and S/N (bottom panel) of the transit observations on Night 1 (blue) and Night 2 (green). In the bottom panel, the solid lines show the S/N in the VIS channel and the dot-dashed lines indicate the S/N in the NIR channel. The vertical-dashed lines indicate the first and last contacts of the transit.
Current usage metrics show cumulative count of Article Views (full-text article views including HTML views, PDF and ePub downloads, according to the available data) and Abstracts Views on Vision4Press platform.
Data correspond to usage on the plateform after 2015. The current usage metrics is available 48-96 hours after online publication and is updated daily on week days.
Initial download of the metrics may take a while.