Free Access
Fig. A.4
Download original image
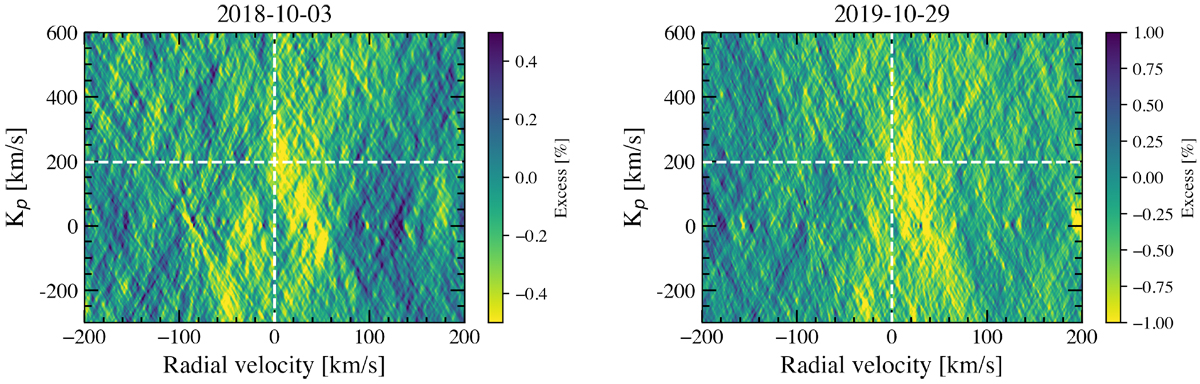
Kp-velocity map around the He I lines for each individual night, obtained applying the telluric correction. The horizontal and vertical white-dashed lines show the expected velocity position of the signal (0 km s−1) and the expected Kp value (196.52 km s−1), respectively.
Current usage metrics show cumulative count of Article Views (full-text article views including HTML views, PDF and ePub downloads, according to the available data) and Abstracts Views on Vision4Press platform.
Data correspond to usage on the plateform after 2015. The current usage metrics is available 48-96 hours after online publication and is updated daily on week days.
Initial download of the metrics may take a while.