Fig. A.2
Download original image
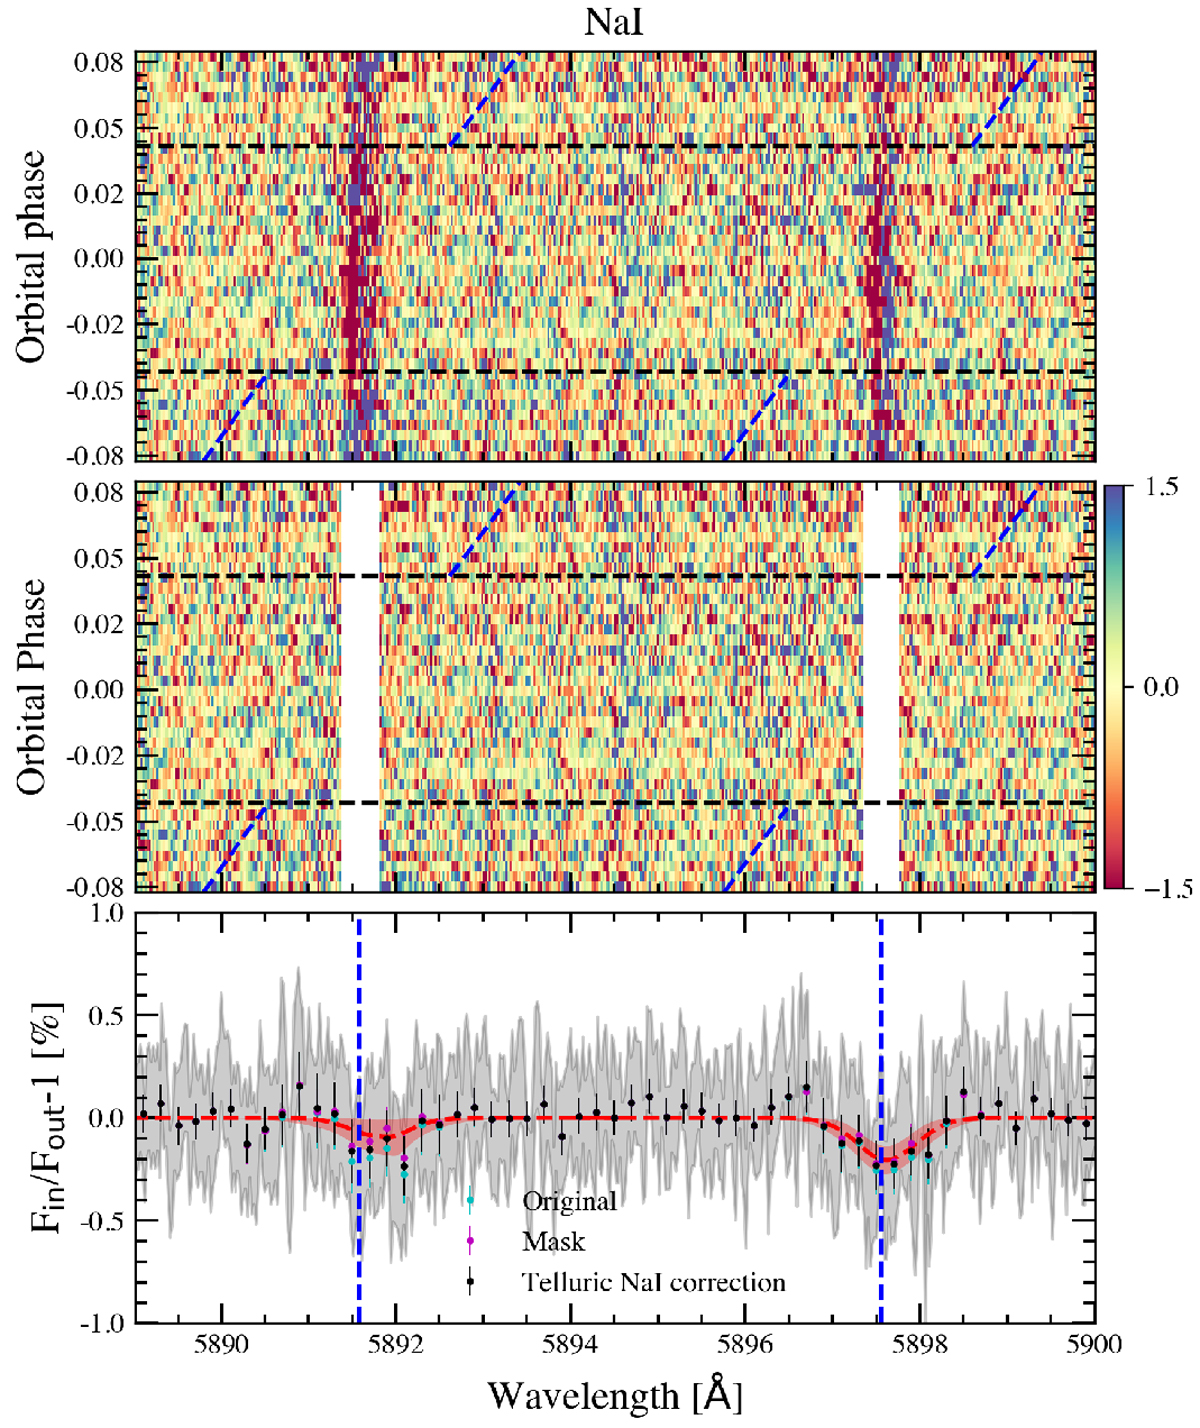
Same as Fig. 8, but for the Na I D1 and D2 lines. The middle panel shows the same as the top panel but after masking the contaminated stellar line cores around ± 10 km s−1 (white regions). The bottom panel shows the transmission spectrum obtained using different methodologies: using all data from the top panel (cyan), masking the centre of the stellar Na I lines core as in the middle panel (magenta), and correcting the telluric Na I emission contamination (black). The transmission spectrum is binned by 0.2Å for better visualisation. The best-fit Gaussian profile is shown in red.
Current usage metrics show cumulative count of Article Views (full-text article views including HTML views, PDF and ePub downloads, according to the available data) and Abstracts Views on Vision4Press platform.
Data correspond to usage on the plateform after 2015. The current usage metrics is available 48-96 hours after online publication and is updated daily on week days.
Initial download of the metrics may take a while.