Fig. 11
Download original image
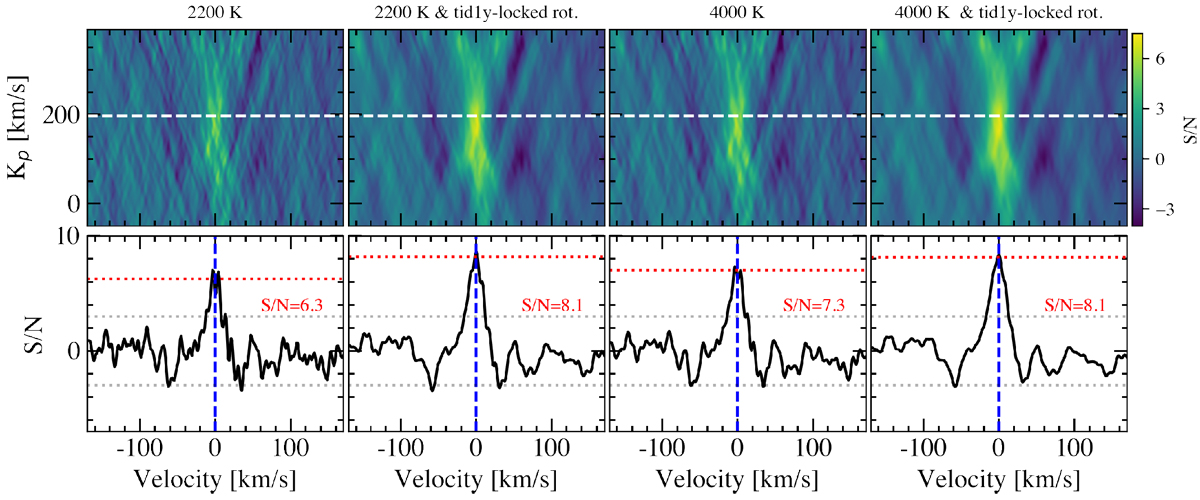
Ca II IRT cross-correlation results using several atmospheric models computed under different assumptions (each column). Top panels: Kp-velocity map. The colour bar indicates the significance (S/N) of the measurement. The white-dashed lines indicate the expected Kp = 196.52 km s−1. Bottom panels: cross-correlation result at the predicted Kp value. The blue-dashed lines show the 0 km s−1 radial velocity and the grey-dotted lines the ±3σ significance level. The red-dotted horizontal lines show the significance of the peak, obtained by fitting a Gaussian profile to the transmission signal.
Current usage metrics show cumulative count of Article Views (full-text article views including HTML views, PDF and ePub downloads, according to the available data) and Abstracts Views on Vision4Press platform.
Data correspond to usage on the plateform after 2015. The current usage metrics is available 48-96 hours after online publication and is updated daily on week days.
Initial download of the metrics may take a while.