Fig. 10
Download original image
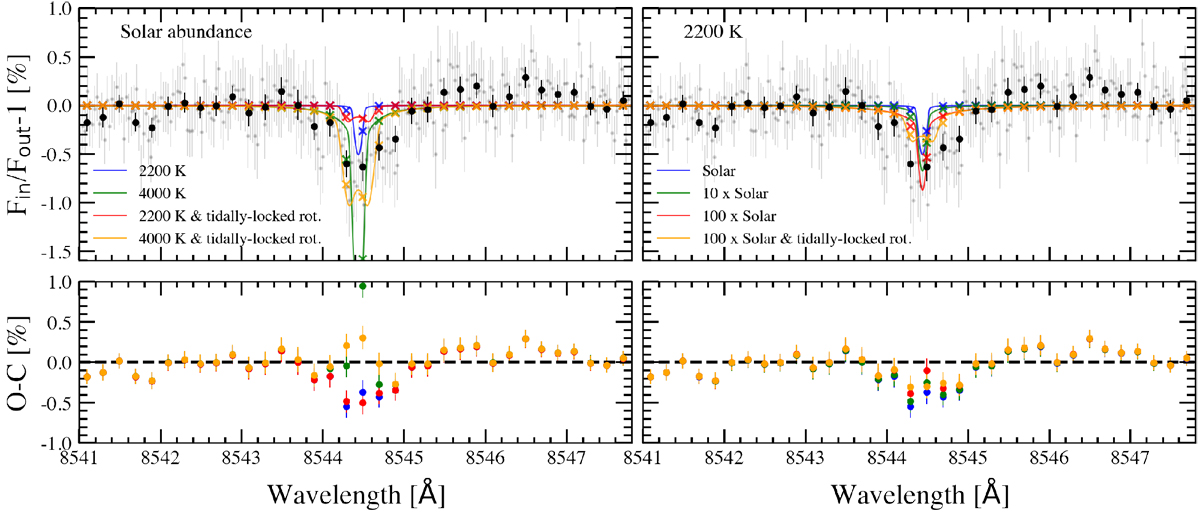
CARMENES transmission spectrum of WASP-76b obtained around the Ca II IRT λ8544Å line compared to different atmospheric models. Top panels: the original data are shown in light grey, the data binned by 0.2Å are shown in black dots, and the models binned by the same amount are presented in coloured crosses. Top left panel: models computed assuming solar abundance. The blue and green lines show the transmission models derived assuming 2200 K and 4000 K, without considering rotational broadening. In red and orange we present the atmospheric models at these same temperatures, but considering a tidally locked rotational broadening. Top right panel: atmospheric models computed assuming a temperature of 2200 K but considering different abundances: solar (blue; same as in the top panel), 10 times solar (green), 100 times the solar abundance without (red) and with (orange) tidally locked rotation. Bottom panels: residuals between the transmission spectrum and the different models (same colours as in top panels). The black-dashed line shows the reference at 0 %.
Current usage metrics show cumulative count of Article Views (full-text article views including HTML views, PDF and ePub downloads, according to the available data) and Abstracts Views on Vision4Press platform.
Data correspond to usage on the plateform after 2015. The current usage metrics is available 48-96 hours after online publication and is updated daily on week days.
Initial download of the metrics may take a while.