Fig. 8
Download original image
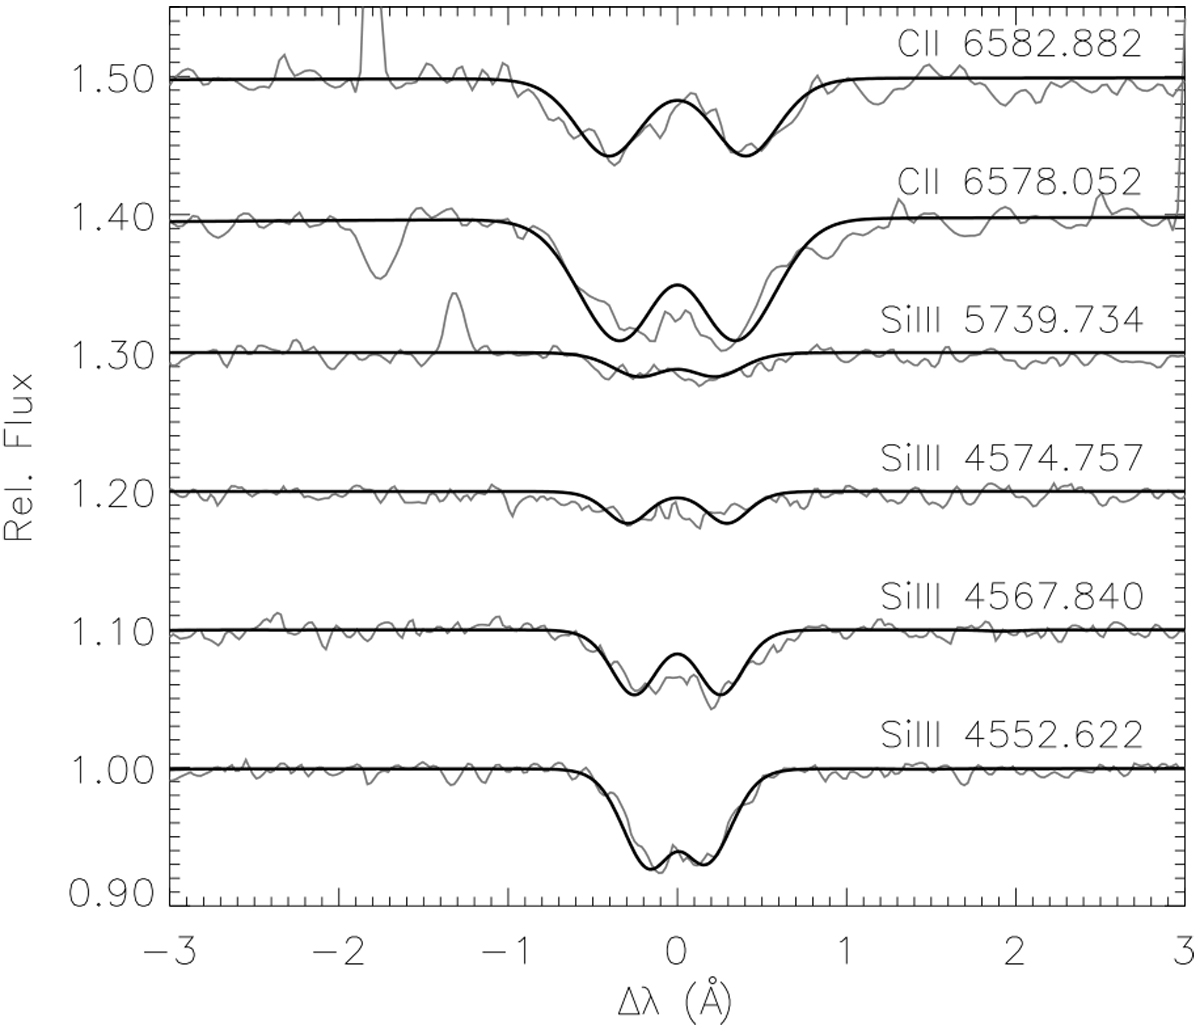
Modelling (black line) of the Zeeman splitting assuming a longitudinal field of 15 kG for several observed spectral features (grey lines). Displayed are relative fluxes, each offset by 0.1 units, as a function of wavelength difference relative to the line centre. A line identification and the laboratory wavelengths are indicated for each feature.
Current usage metrics show cumulative count of Article Views (full-text article views including HTML views, PDF and ePub downloads, according to the available data) and Abstracts Views on Vision4Press platform.
Data correspond to usage on the plateform after 2015. The current usage metrics is available 48-96 hours after online publication and is updated daily on week days.
Initial download of the metrics may take a while.