Fig. 1
Download original image
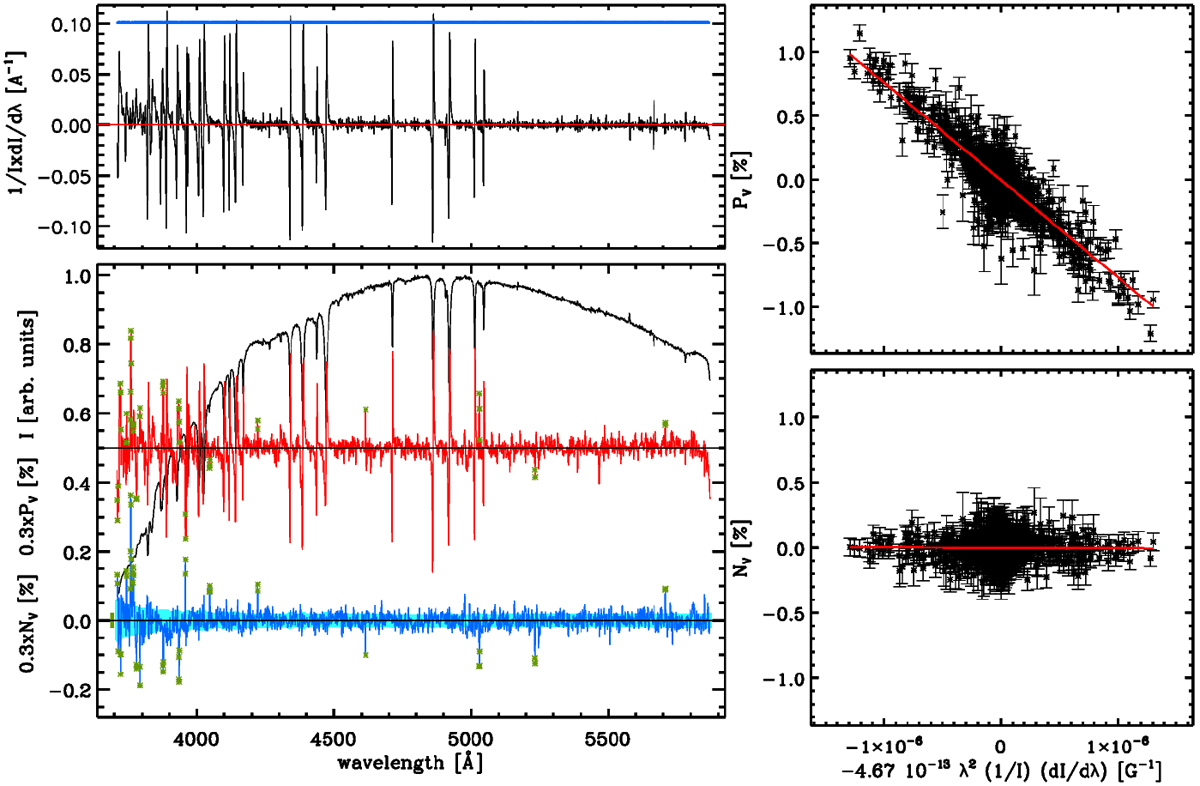
Overview of FORS2 analysis and results from the observations of HD 144941 collected on March 15, 2021 considering the full spectrum. Top left panel: derivative of Stokes I. The thick blue line on top of the panel indicates the region used to compute ⟨Bz⟩. Bottom left panel: from top to bottom, the panel shows the Stokes I spectrum (black) arbitrarily normalised to the highest value, the Stokes V spectrum (in %; red) rigidly shifted upwards by 0.5% for visualisation reasons, and the spectrum of the N parameter (in %; blue). The green asterisks mark the points that were removed by the sigma-clipping algorithm. The pale blue strip drawn on top of the N profile showsthe uncertainty associated with each spectral point. The thick green bar on the left side of the spectrum of the N parameter shows the standard deviation of the N profile. Top right panel: linear fit from which ⟨Bz⟩ is determined. The red solid line shows the best fit giving ⟨Bz⟩ = −7626 ± 86 G. Bottom rightpanel: same as the top right panel, but for the N profile (i.e. ⟨Nz⟩), from which we obtain ⟨Nz⟩ = −32 ± 71 G.
Current usage metrics show cumulative count of Article Views (full-text article views including HTML views, PDF and ePub downloads, according to the available data) and Abstracts Views on Vision4Press platform.
Data correspond to usage on the plateform after 2015. The current usage metrics is available 48-96 hours after online publication and is updated daily on week days.
Initial download of the metrics may take a while.