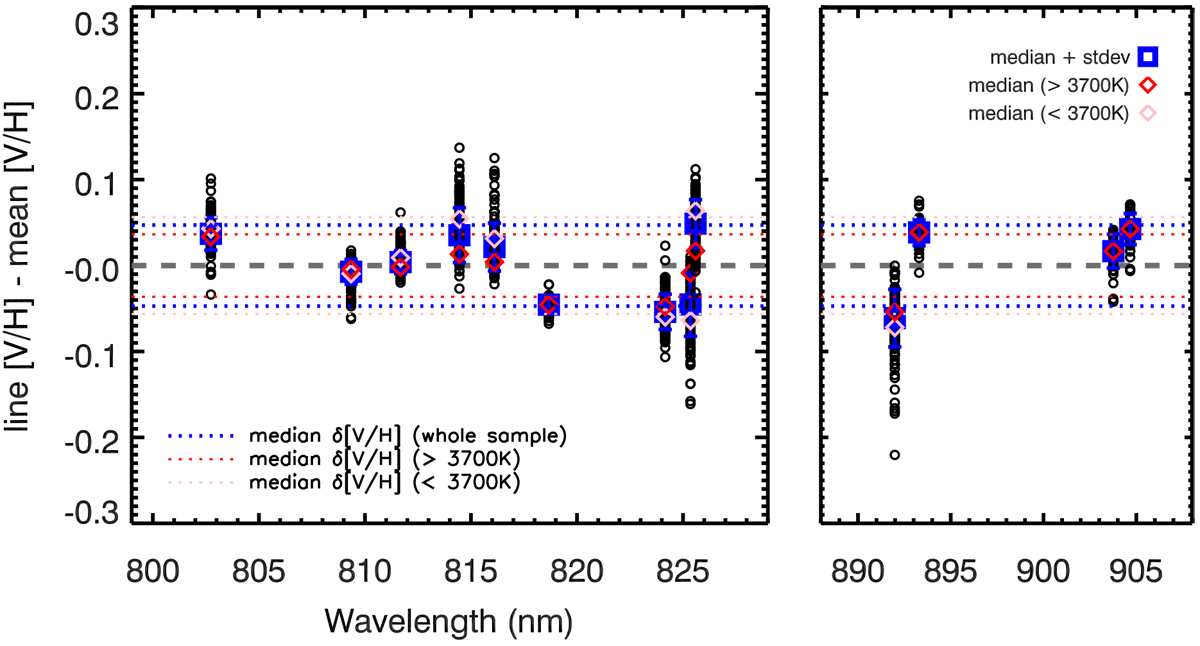
Fig. 5
Download original image
Individual line abundance deviations from the mean abundance across the lines for the star sample. At each given line wavelength (in air), the black circles denote the line [V/H] − mean [V/H] for each star in which that line was studied. The thick orange squares show the median abundancedeviation and sample standard deviation for each line (over all the CARMENES stars for whichthat line was used). The blue and red squares mark the same metric for the warmer (Teff >3700 K) and cooler (Teff < 3700 K) subsamples, respectively. The horizontal dotted lines bracket the median abundance error (in terms of the line-to-line standard deviation) for the whole sample (± 0.047 dex, blue squares), the warmer subsample (± 0.036 dex, red diamonds), and the cooler subsample (± 0.056 dex, pink diamonds). The V I λ818.6728 nm, λ893.2947 nm, λ903.7613 nm, and λ904.6693 nm lines were not fitted for stars with Teff < 3700 K.
Current usage metrics show cumulative count of Article Views (full-text article views including HTML views, PDF and ePub downloads, according to the available data) and Abstracts Views on Vision4Press platform.
Data correspond to usage on the plateform after 2015. The current usage metrics is available 48-96 hours after online publication and is updated daily on week days.
Initial download of the metrics may take a while.