Fig. 4
Download original image
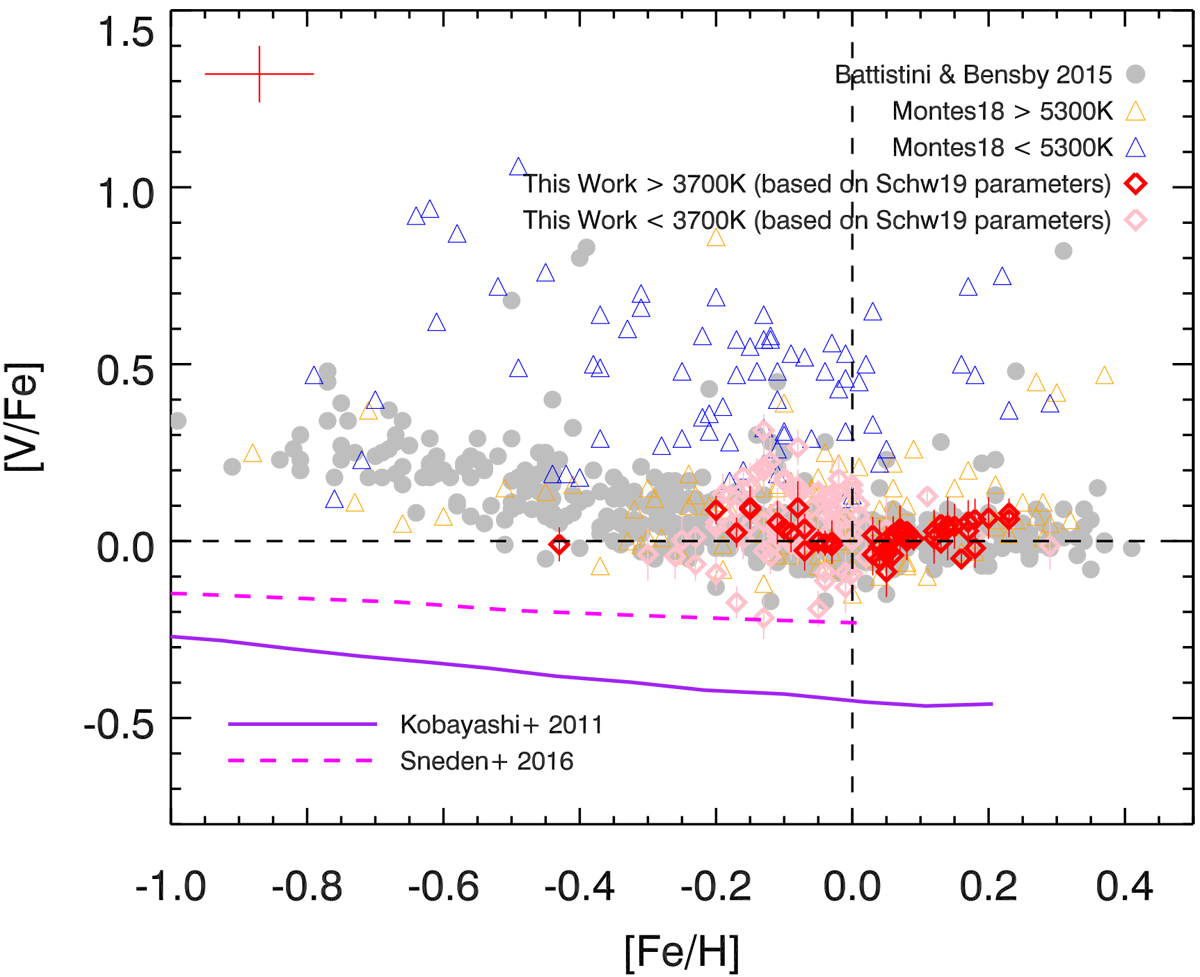
[V/Fe] versus [Fe/H] diagram of the 135 CARMENES GTO stars derived from our line-by-line analysis (red diamonds for Teff > 3700 K and pink diamonds for Teff < 3700 K). Each vertical error bar represents the sample standard deviation of the abundances derived from the set of V lines used for each star. The typical error in the literature metallicity used in our analysis is 0.16 dex (Schw19), also shown in the upper left of the figure. Overplotted are selected representative V measurements in populations of nearby FGK stars from the literature. Gray filled circles are measurements from Battistini & Bensby (2015) for local FG dwarfs. The triangles show results from Montes et al. (2018) for local FGK dwarfs, with blue denoting the K-dwarf subsample therein (Teff <5300 K). The V abundances measured for these K dwarfs are generally significantly higher than for the rest of the stars, possibly a consequence of not having accounted for HFS in the modeling. The purple line shows the predicted trend for the solar neighborhood from the Galactic chemical evolution models of Kobayashi et al. (2011). The dashed magenta line shows a model from Sneden et al. (2016), which is built upon the Kobayashi et al. (2011) model but incorporates a hypernova jet effect.
Current usage metrics show cumulative count of Article Views (full-text article views including HTML views, PDF and ePub downloads, according to the available data) and Abstracts Views on Vision4Press platform.
Data correspond to usage on the plateform after 2015. The current usage metrics is available 48-96 hours after online publication and is updated daily on week days.
Initial download of the metrics may take a while.