Fig. 2
Download original image
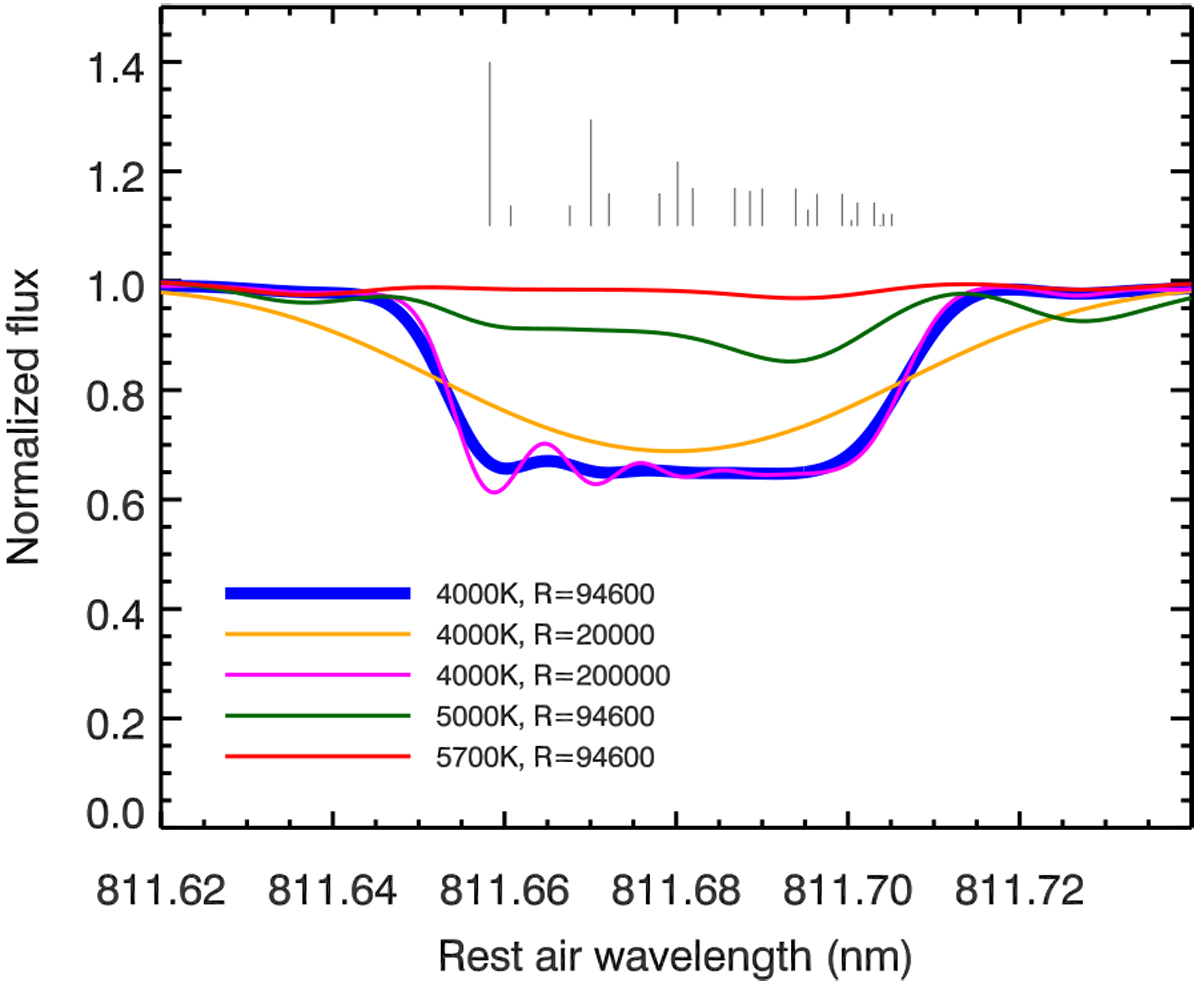
Synthetic spectra around the dramatically split V I λ811.7 nm synthesized by iSpec using the latest VALD3-HFS line list for solar vanadium abundance. This feature comprises 21 components, indicated by gray vertical lines whose heights scale with their expected relative strengths at T = 4000 K, with EW used as a proxy for strength, log(EW) = log(gfλ) − θχ, where λ is the transition wavelength in Å, θ = 5040∕T, temperature T is in K, and χ is the lower excitation potential of the transition in eV. The strongest components toward the left side of the feature manifest themselves as marginally resolved “wiggles” in spectra with CARMENES-like resolution.
Current usage metrics show cumulative count of Article Views (full-text article views including HTML views, PDF and ePub downloads, according to the available data) and Abstracts Views on Vision4Press platform.
Data correspond to usage on the plateform after 2015. The current usage metrics is available 48-96 hours after online publication and is updated daily on week days.
Initial download of the metrics may take a while.