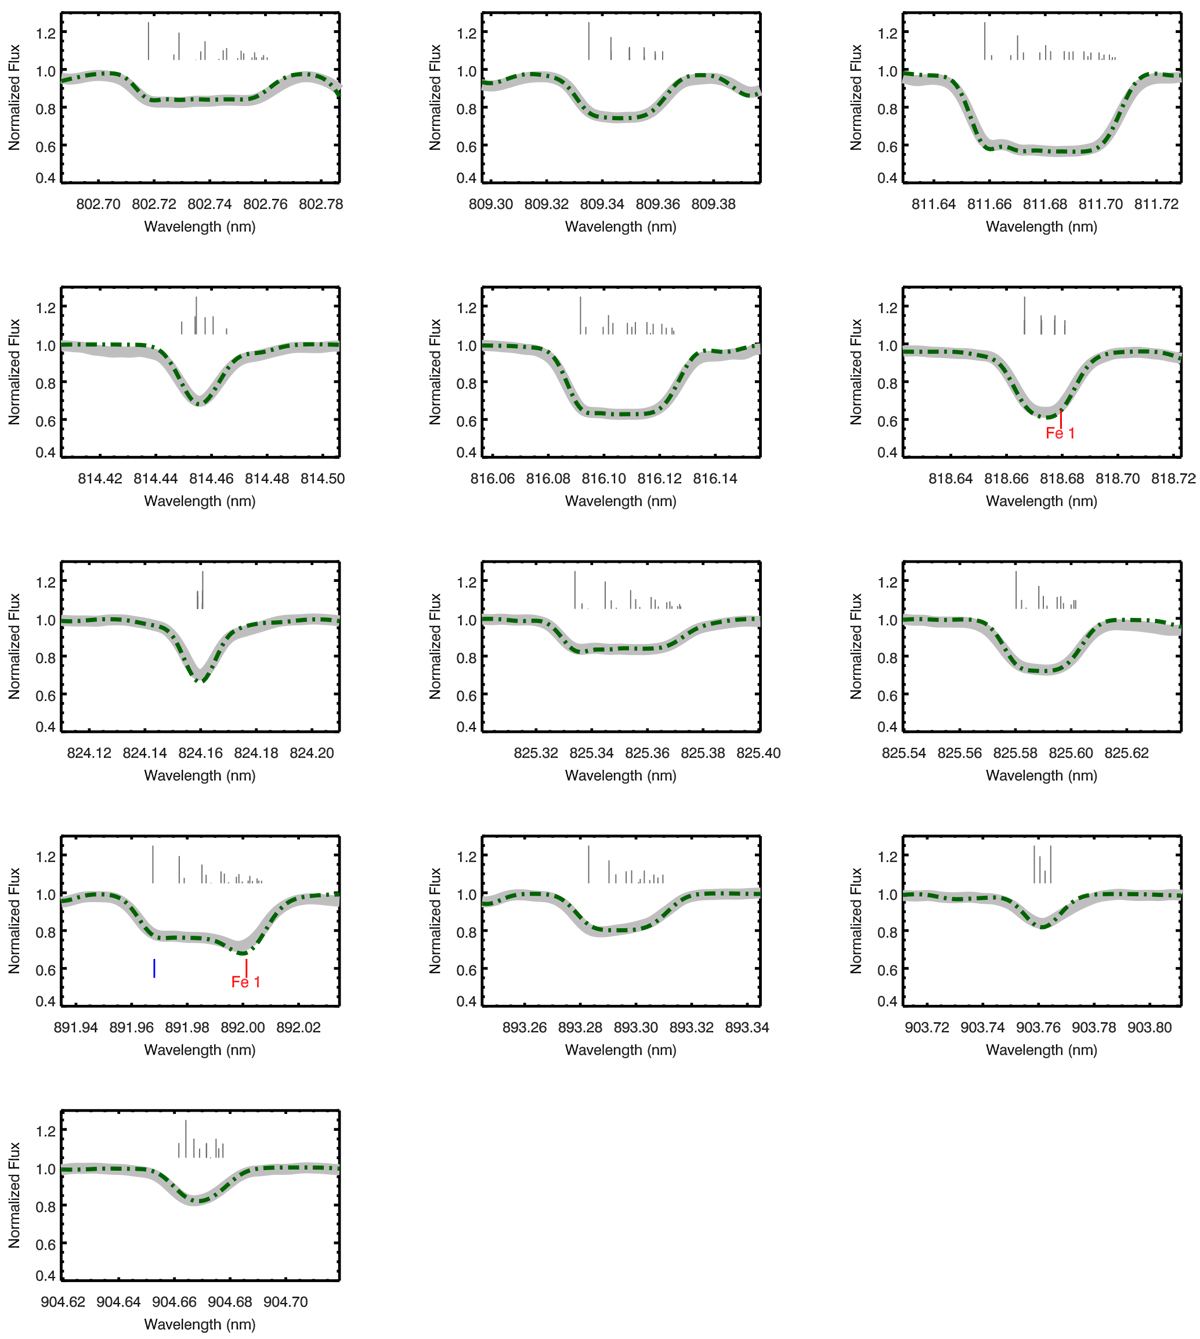
Fig. C.1
Download original image
AllV I line regions fitted to the observed CARMENES spectrum (thick gray) of a typical M0.0 V star (J14257+236W). The model corresponding to the best-fit V abundance, using the Schw19 stellar parameters, is shown in green dot-dashed lines. Individual V I HFS components and their relative strengths, as given by log (gfλ) − θχ, are shown in vertical gray lines above each feature. Notable contaminating lines (i.e., expected depth > 0.05) inside the V I features from other species are marked in blue (for TiO) and red.
Current usage metrics show cumulative count of Article Views (full-text article views including HTML views, PDF and ePub downloads, according to the available data) and Abstracts Views on Vision4Press platform.
Data correspond to usage on the plateform after 2015. The current usage metrics is available 48-96 hours after online publication and is updated daily on week days.
Initial download of the metrics may take a while.