Fig. 10
Download original image
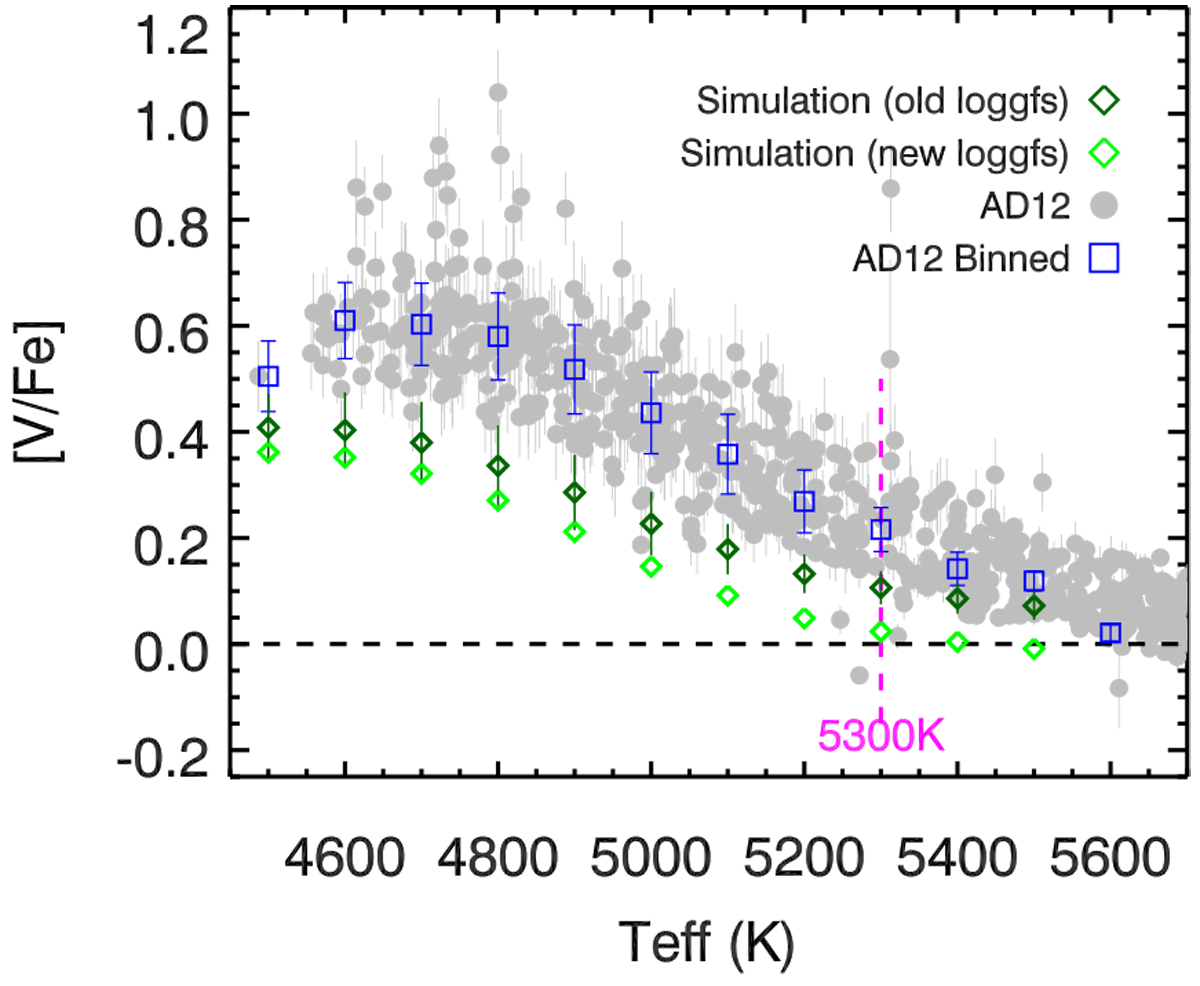
Vanadium abundances based on line-by-line synthetic spectral fitting analysis without HFS on mock spectra generated with an HFS line list as a function of temperature, compared to the abundance trend in AD12. The gray filled circles are measurements and error (computed as line-to-line RMS/![]() for seven lines) by AD12 and the blue squares show the median of these measurements and error binned by temperature. The dark green diamonds show the mock retrieval results for model spectra with log (gf) values from Neves et al. (2009) for the V lines, whereas the neon green diamonds use the latest log gf values. Below 5300 K, the “measured” [V/Fe] increases with decreasing effective temperature in a very similar manner asfound by Adibekyan et al. (2012) and others. The observed line-to-line scatter as a function of Teff also resembles the simulated behavior.
for seven lines) by AD12 and the blue squares show the median of these measurements and error binned by temperature. The dark green diamonds show the mock retrieval results for model spectra with log (gf) values from Neves et al. (2009) for the V lines, whereas the neon green diamonds use the latest log gf values. Below 5300 K, the “measured” [V/Fe] increases with decreasing effective temperature in a very similar manner asfound by Adibekyan et al. (2012) and others. The observed line-to-line scatter as a function of Teff also resembles the simulated behavior.
Current usage metrics show cumulative count of Article Views (full-text article views including HTML views, PDF and ePub downloads, according to the available data) and Abstracts Views on Vision4Press platform.
Data correspond to usage on the plateform after 2015. The current usage metrics is available 48-96 hours after online publication and is updated daily on week days.
Initial download of the metrics may take a while.