Fig. 4
Download original image
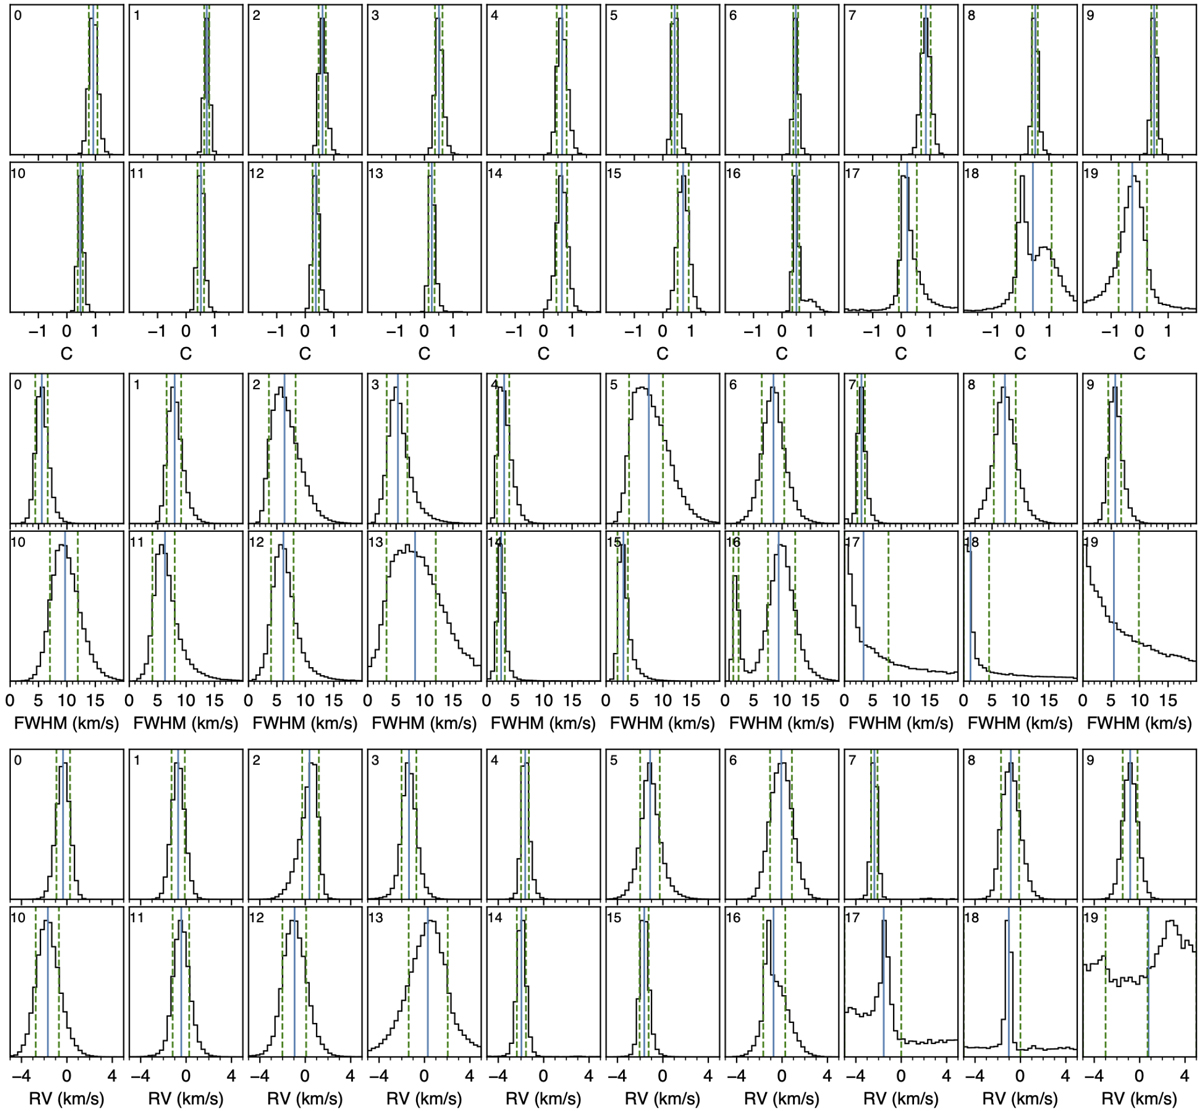
PDFs of the contrast (upper panels), FWHM (middle panels), and RV centroids (lower panels) of the Gaussian line model fitted to individual CCFintr during the transit of HD 3167c. Deep blue lines indicate the PDF median values, with dashed green lines showing the 1σ highest density intervals. In-transit exposure indexes are shown in each subplot.
Current usage metrics show cumulative count of Article Views (full-text article views including HTML views, PDF and ePub downloads, according to the available data) and Abstracts Views on Vision4Press platform.
Data correspond to usage on the plateform after 2015. The current usage metrics is available 48-96 hours after online publication and is updated daily on week days.
Initial download of the metrics may take a while.