Fig. 3
Download original image
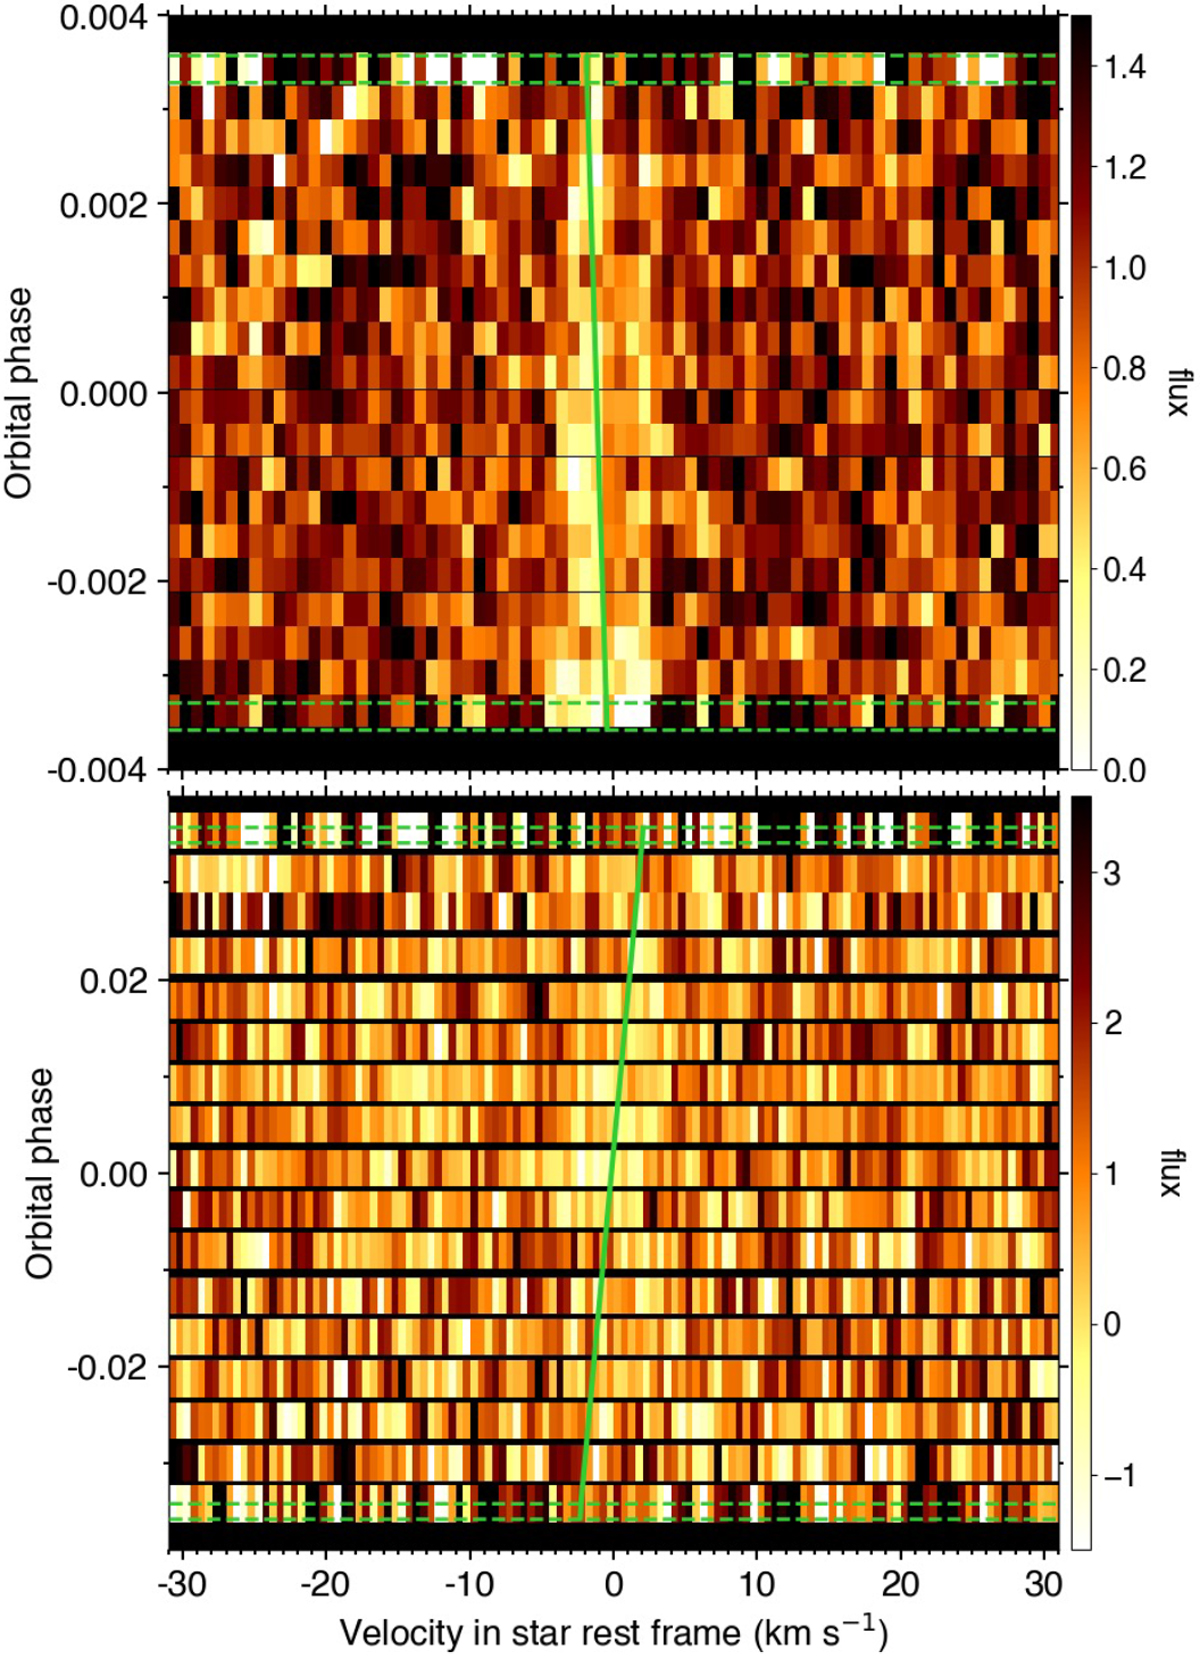
Maps of the CCFintr during the transits of HD 3167 c (HARPS-N, upper panel) and HD 3167 b (ESPRESSO, lower panel). Transit contacts are shown as green dashed lines. Values are colored as a function of their normalized flux and plotted as a function of RV in the stellar rest frame (in abscissa) and orbital phase (in ordinate). HD 3167c is large enough that the stellar line can be distinguished in individual exposures, while the small transit depth of HD 3167b makes the line undetectable in most exposures even with the VLT/ESPRESSO data. The green solid lines show the best-fit models for the stellar surface RVs derived with the joint RMR fit to both data sets.
Current usage metrics show cumulative count of Article Views (full-text article views including HTML views, PDF and ePub downloads, according to the available data) and Abstracts Views on Vision4Press platform.
Data correspond to usage on the plateform after 2015. The current usage metrics is available 48-96 hours after online publication and is updated daily on week days.
Initial download of the metrics may take a while.