Fig. 14
Download original image
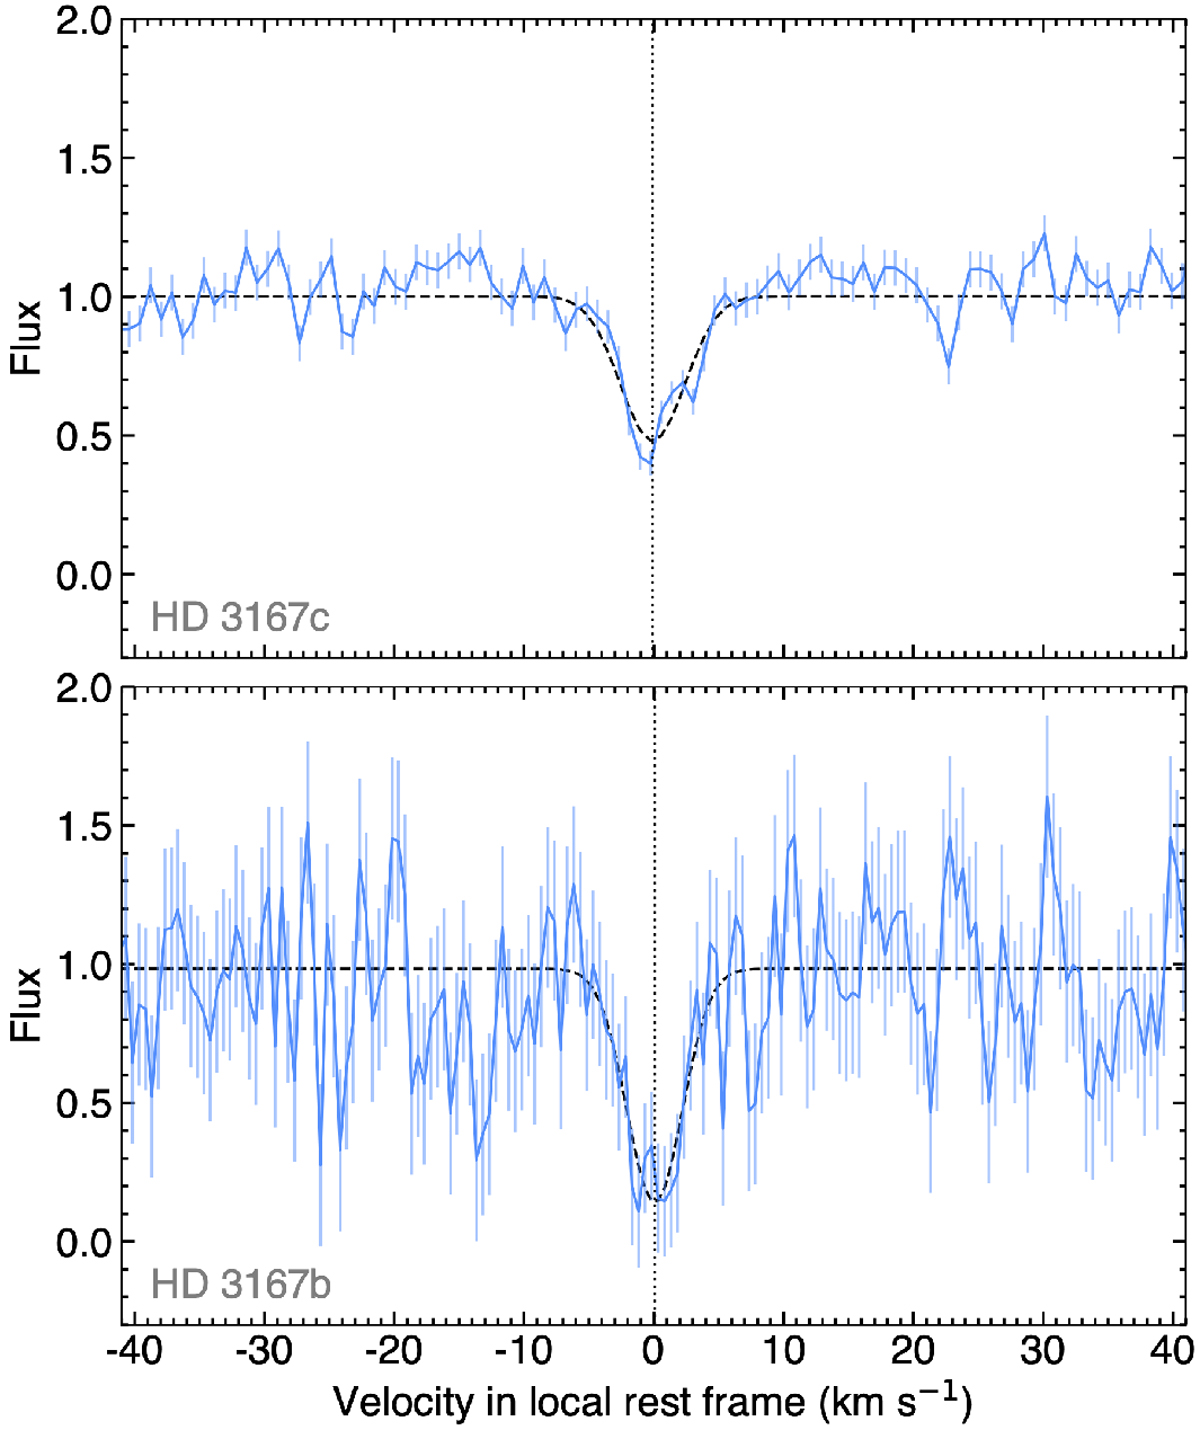
Average local stellar lines along the transit chords of HD 3167c (top panel) and HD 3167b (bottom panel). The same flux scale is used to highlight the difference in line contrast, arising from the different stellar regions probed by the planets, andthe difference in signal quality, due to the different planet sizes. Dashed black lines show best-fit Gaussian profiles to the stellar lines.
Current usage metrics show cumulative count of Article Views (full-text article views including HTML views, PDF and ePub downloads, according to the available data) and Abstracts Views on Vision4Press platform.
Data correspond to usage on the plateform after 2015. The current usage metrics is available 48-96 hours after online publication and is updated daily on week days.
Initial download of the metrics may take a while.