Fig. 13
Download original image
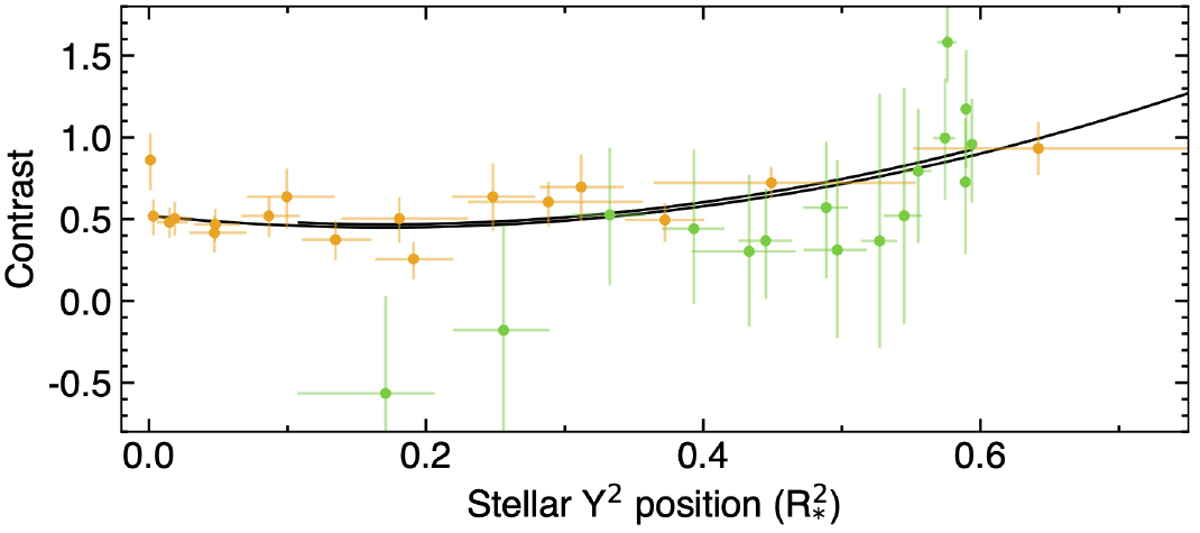
Local contrast of the stellar lines occulted by HD 3167b (green) and HD 3167c (orange), derived from the fits to individual exposures (Sect. 4.3, Figs. 5 and 7). Solid black lines show the best-fit model for the contrast variations as a function of the squared latitude coordinate
![]() (ranging from 0 at the stellar equator to 1 at the poles), after convolution by the HARPS-N and ESPRESSO LSFs. We note that the models were derived from the RMR fit to the combined datasets.
(ranging from 0 at the stellar equator to 1 at the poles), after convolution by the HARPS-N and ESPRESSO LSFs. We note that the models were derived from the RMR fit to the combined datasets.
Current usage metrics show cumulative count of Article Views (full-text article views including HTML views, PDF and ePub downloads, according to the available data) and Abstracts Views on Vision4Press platform.
Data correspond to usage on the plateform after 2015. The current usage metrics is available 48-96 hours after online publication and is updated daily on week days.
Initial download of the metrics may take a while.