Fig. 8
Download original image
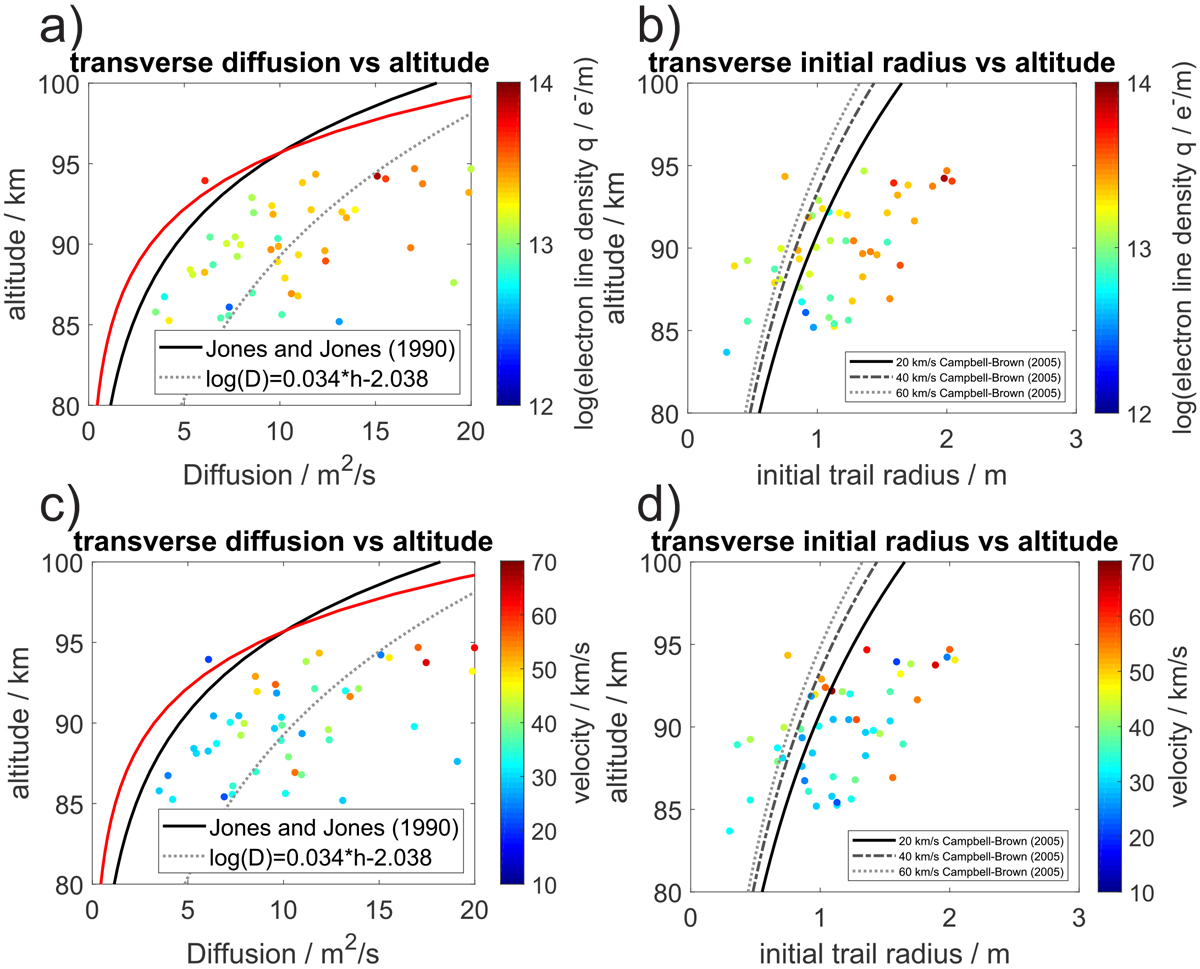
Comparison of transverse scatter fits. (a) Diffusion versa altitude scatter plot with color coded electron line density. (b) Initial trail radius versa altitude scatter plot with color coded electron line density. (c) Diffusion versa altitude scatter plot with color coded time of flight meteor velocity. (d) Initial trail radius versa altitude scatter plot with color coded time of flight velocity. The initial radius as a function of altitude and speed as measured by Jones & Campbell-Brown (2005) is also shown for comparison.
Current usage metrics show cumulative count of Article Views (full-text article views including HTML views, PDF and ePub downloads, according to the available data) and Abstracts Views on Vision4Press platform.
Data correspond to usage on the plateform after 2015. The current usage metrics is available 48-96 hours after online publication and is updated daily on week days.
Initial download of the metrics may take a while.