Fig. 9
Download original image
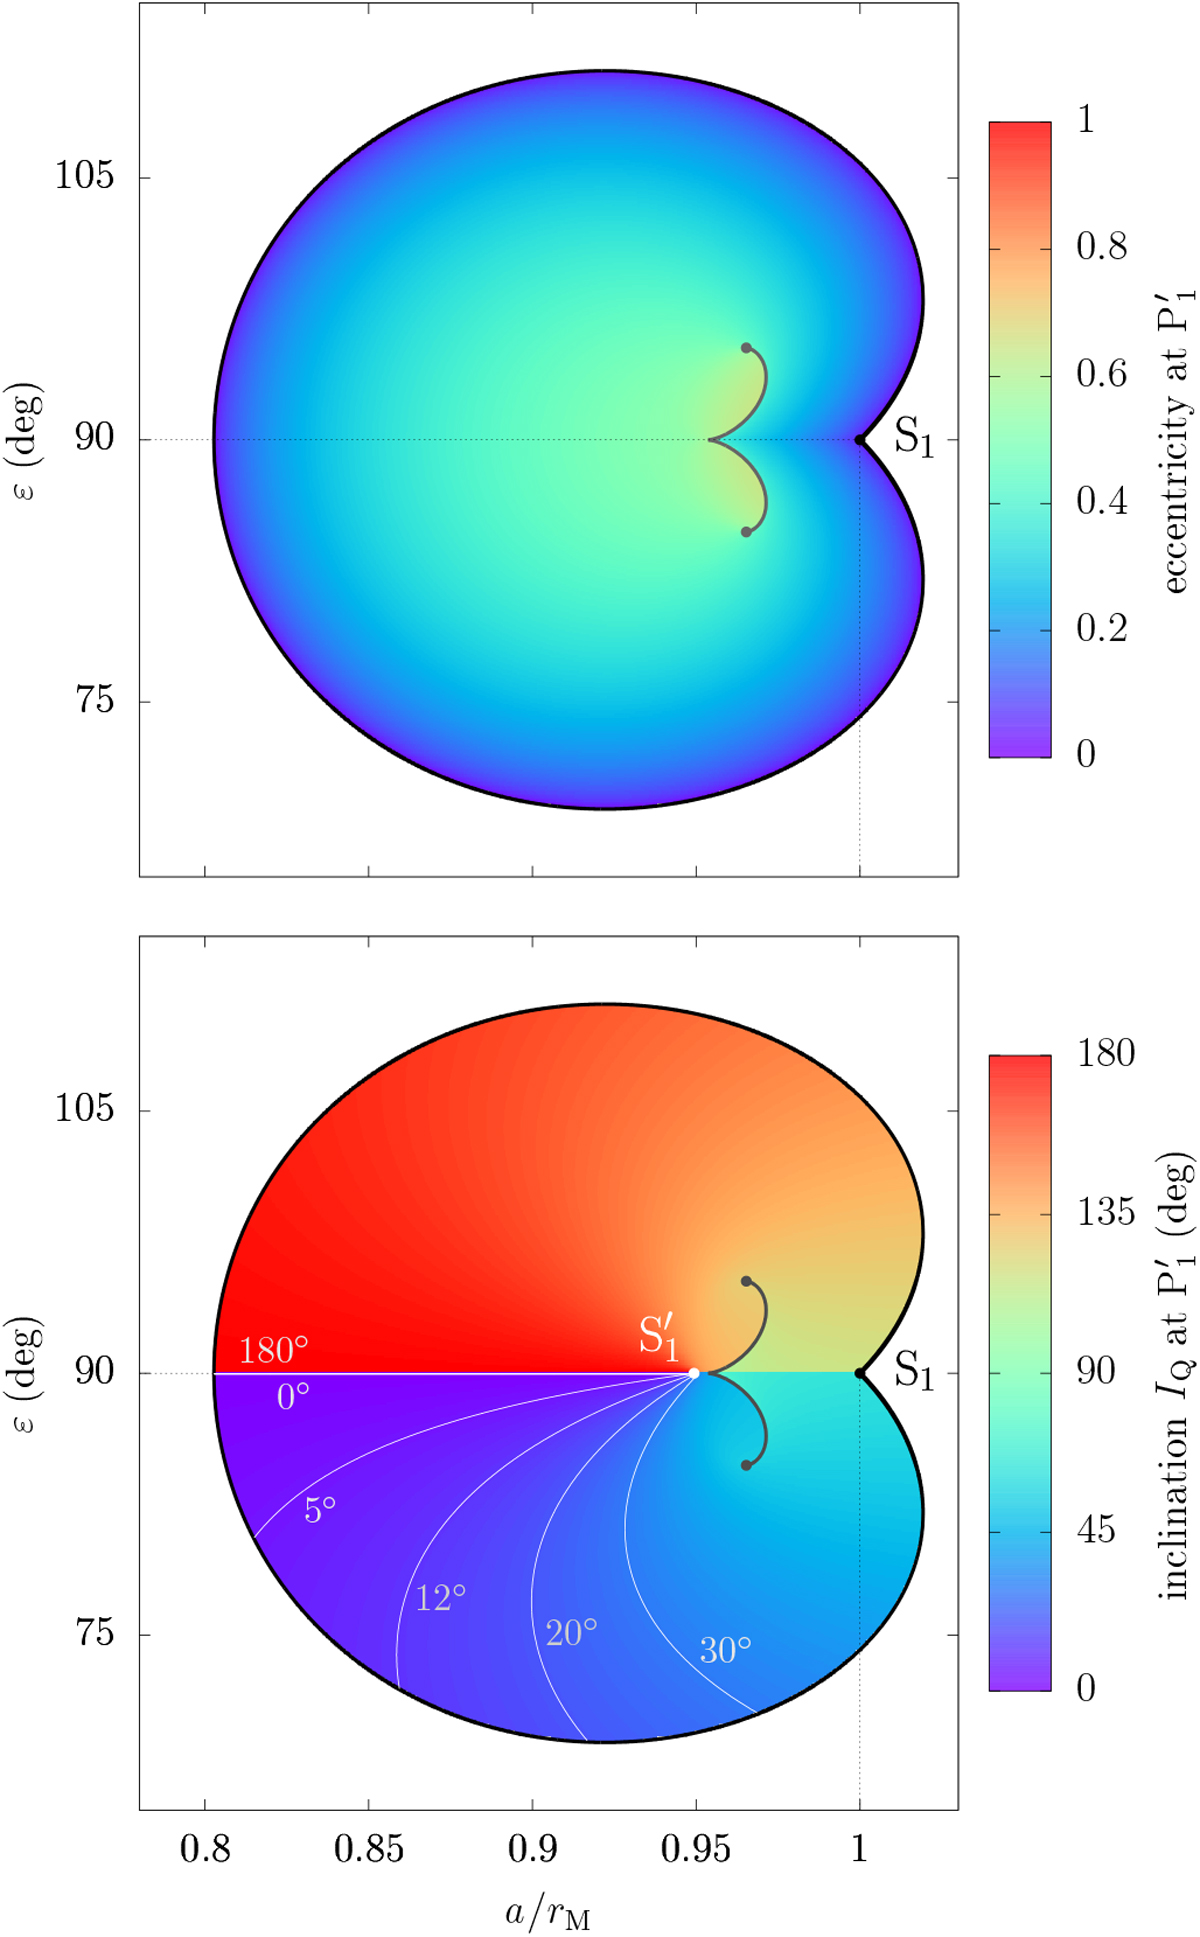
Eccentricity and inclination of the satellite at the eccentric equilibrium P![]() . The three-dimensional surface of equilibrium has been cut along the grey line, as shown in Fig. 10. In the bottom panel, some level curves are plotted in white (see labels). Noting
. The three-dimensional surface of equilibrium has been cut along the grey line, as shown in Fig. 10. In the bottom panel, some level curves are plotted in white (see labels). Noting
![]() , the extremity of the grey cutting line have coordinates
, the extremity of the grey cutting line have coordinates ![]() and
and ![]() at the top and bottom points, and
at the top and bottom points, and ![]() and ε = 90° at the middle.
and ε = 90° at the middle.
Current usage metrics show cumulative count of Article Views (full-text article views including HTML views, PDF and ePub downloads, according to the available data) and Abstracts Views on Vision4Press platform.
Data correspond to usage on the plateform after 2015. The current usage metrics is available 48-96 hours after online publication and is updated daily on week days.
Initial download of the metrics may take a while.