Fig. C.8
Download original image
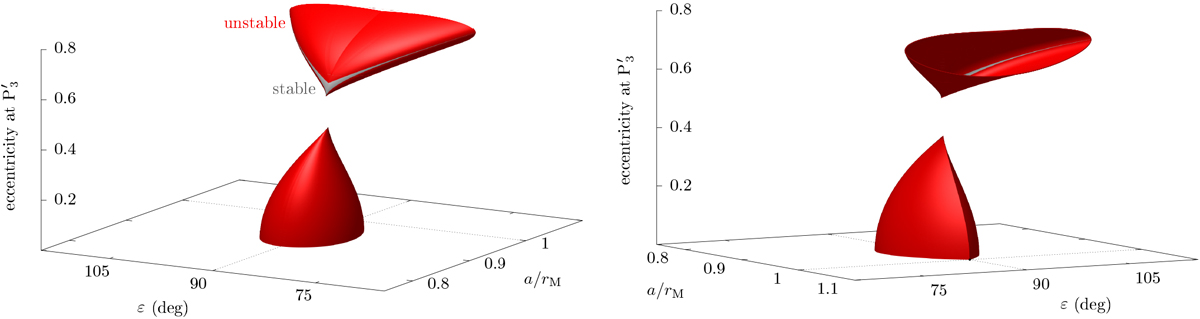
Stability of the equilibrium point P![]() as a function of the parameters. The stable and unstable regions are painted in grey and red, respectively, and they are projected on the three-dimensional surface describing the eccentricity of the satellite. As in Fig. C.7, the surface is seen from two viewing angles and the top tube-like portion has been cut for better readability.
as a function of the parameters. The stable and unstable regions are painted in grey and red, respectively, and they are projected on the three-dimensional surface describing the eccentricity of the satellite. As in Fig. C.7, the surface is seen from two viewing angles and the top tube-like portion has been cut for better readability.
Current usage metrics show cumulative count of Article Views (full-text article views including HTML views, PDF and ePub downloads, according to the available data) and Abstracts Views on Vision4Press platform.
Data correspond to usage on the plateform after 2015. The current usage metrics is available 48-96 hours after online publication and is updated daily on week days.
Initial download of the metrics may take a while.