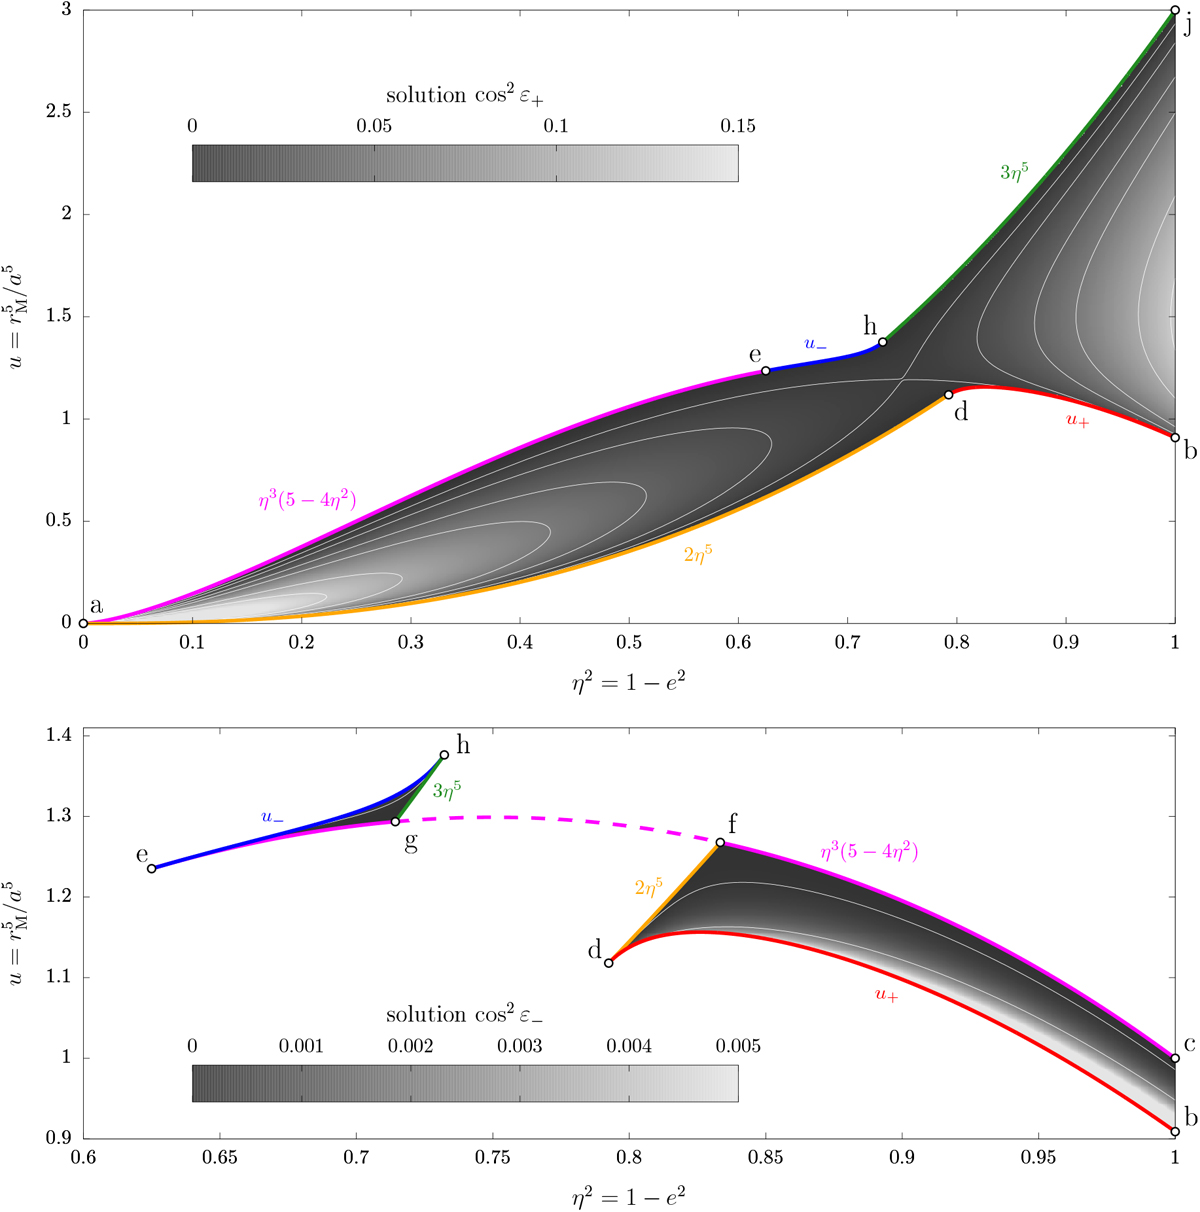
Fig. C.1

Download original image
Location of the eccentric equilibrium P![]() as a function of the parameters. The colour shades show the two closed-form obliquity solutions given by Eq. (C.2). Some levels are highlighted in white. The definition regions of the solutions are bounded by curves of the form u = f(η), as labelled on the figures (coloured curves). Among those, u+ and u− are given in Eq. (C.5). The junction points (black labels) are given in Table C.1.
as a function of the parameters. The colour shades show the two closed-form obliquity solutions given by Eq. (C.2). Some levels are highlighted in white. The definition regions of the solutions are bounded by curves of the form u = f(η), as labelled on the figures (coloured curves). Among those, u+ and u− are given in Eq. (C.5). The junction points (black labels) are given in Table C.1.
Current usage metrics show cumulative count of Article Views (full-text article views including HTML views, PDF and ePub downloads, according to the available data) and Abstracts Views on Vision4Press platform.
Data correspond to usage on the plateform after 2015. The current usage metrics is available 48-96 hours after online publication and is updated daily on week days.
Initial download of the metrics may take a while.


