Fig. 2
Download original image
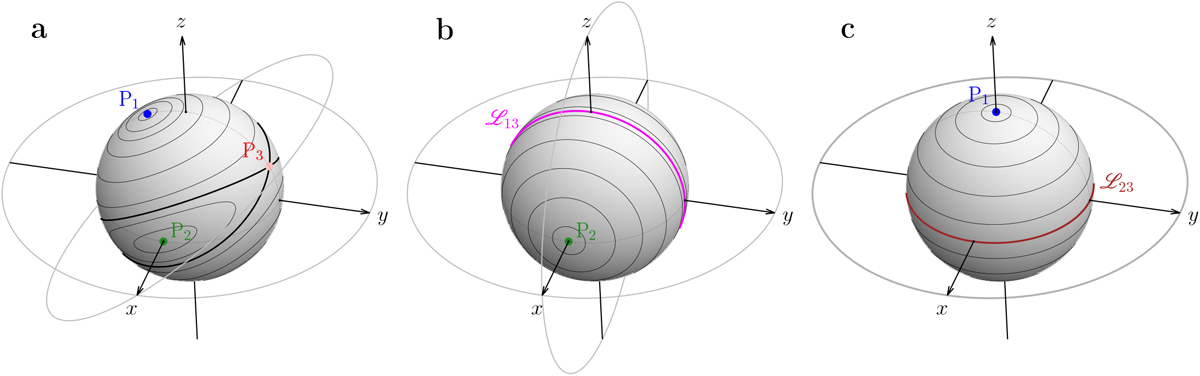
Level curves of the Hamiltonian function ![]() with e = 0 plotted on the sphere. The z-axis is along the spin axis of the planet. The x-axis is along the intersection of the equatorial and ecliptic planes (i.e. the line joining both equinoxes of the planet) and directed towards the ascending node of the star. The equator xy plane and the ecliptic plane are highlighted by the two outer grey circles. A point on the sphere represents the tip of the orbital angular momentum of the satellite, which has coordinates (x, y, z) = (sinIQ sinδQ, −sinIQ cosδQ, cos IQ). The colour code is the same as in Fig. 1. Panel a: same parameters as Fig. 1. Panel b: parameter region S1, defined by a∕rM = 1 and ε = 90°. The magenta curve
with e = 0 plotted on the sphere. The z-axis is along the spin axis of the planet. The x-axis is along the intersection of the equatorial and ecliptic planes (i.e. the line joining both equinoxes of the planet) and directed towards the ascending node of the star. The equator xy plane and the ecliptic plane are highlighted by the two outer grey circles. A point on the sphere represents the tip of the orbital angular momentum of the satellite, which has coordinates (x, y, z) = (sinIQ sinδQ, −sinIQ cosδQ, cos IQ). The colour code is the same as in Fig. 1. Panel a: same parameters as Fig. 1. Panel b: parameter region S1, defined by a∕rM = 1 and ε = 90°. The magenta curve ![]() is made of an infinity of stable equilibria resulting from the merging of P1 with the separatrix emerging from P3. Panel c: parameter region S2, defined by a∕rM > 0 and ε = 0° (or 180°). The brown curve
is made of an infinity of stable equilibria resulting from the merging of P1 with the separatrix emerging from P3. Panel c: parameter region S2, defined by a∕rM > 0 and ε = 0° (or 180°). The brown curve ![]() is made of an infinity of stable equilibria resulting from the merging of P2 with the separatrix emerging from P3.
is made of an infinity of stable equilibria resulting from the merging of P2 with the separatrix emerging from P3.
Current usage metrics show cumulative count of Article Views (full-text article views including HTML views, PDF and ePub downloads, according to the available data) and Abstracts Views on Vision4Press platform.
Data correspond to usage on the plateform after 2015. The current usage metrics is available 48-96 hours after online publication and is updated daily on week days.
Initial download of the metrics may take a while.