Fig. 19
Download original image
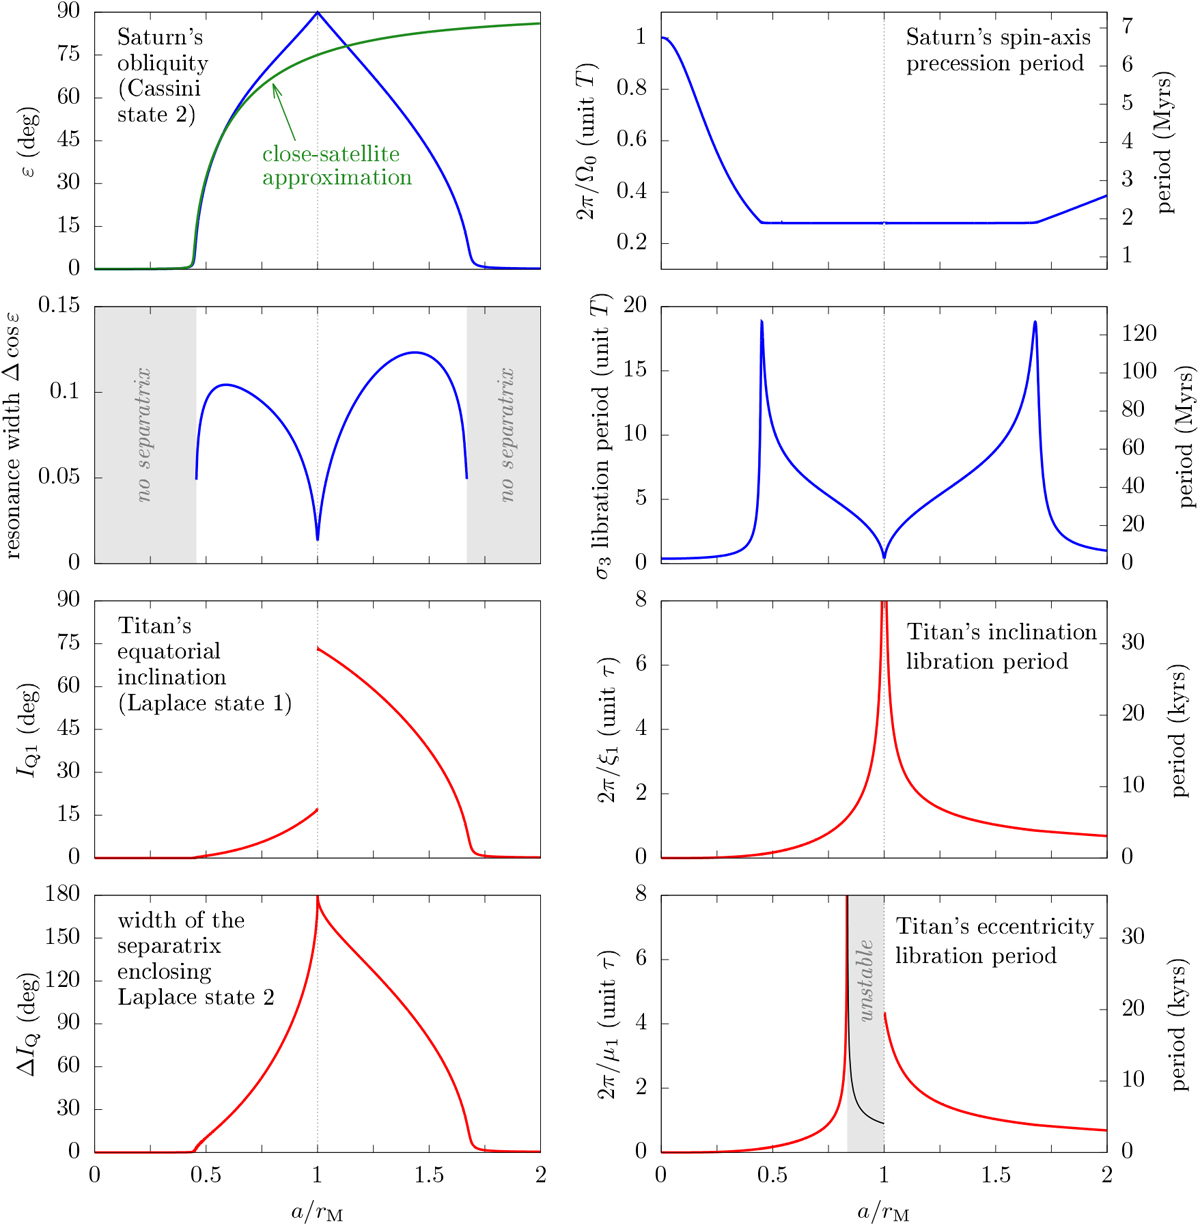
Evolution of Saturn’s spin axis and Titan’s orbit while following the centre of the secular spin–orbit resonance with s8. We use blue for Saturn’s spin axis and red for Titan’s orbit. Each panel is described directly on the graph when the legend is not self-explanatory. In the right column, time is shown both in normalised units (left vertical axis) and in physical units (right vertical axis). The conversion factors are given in Table 1. All curves are obtained through the analytical formulas described in the text, assuming that Saturn closely oscillates near Cassini state 2 and Titan closely oscillates near Laplace state 1. In the top left panel, the green curve shows the location of the resonance centre according to the formula used by Saillenfest et al. (2021b) valid for a close satellite. In the bottom right panel, the black curve in the unstable region corresponds to the period needed for the eccentricity to be multiplied by exp (2π) ≈ 535.
Current usage metrics show cumulative count of Article Views (full-text article views including HTML views, PDF and ePub downloads, according to the available data) and Abstracts Views on Vision4Press platform.
Data correspond to usage on the plateform after 2015. The current usage metrics is available 48-96 hours after online publication and is updated daily on week days.
Initial download of the metrics may take a while.