Fig. 18
Download original image
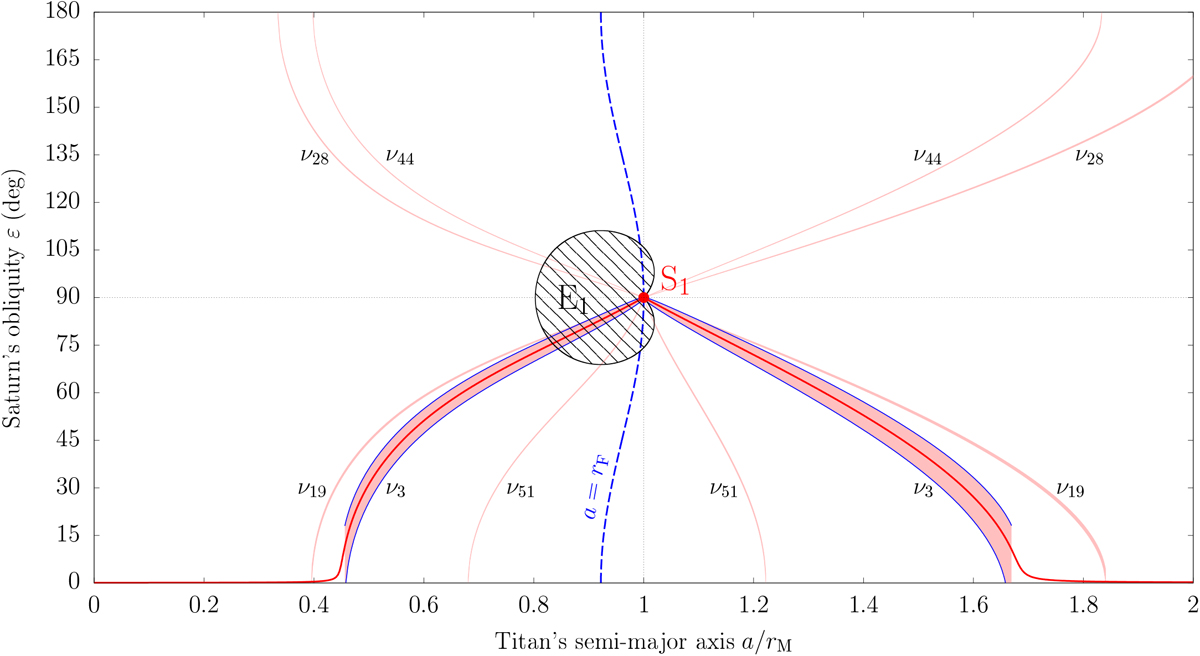
Location and width of every first-order secular spin–orbit resonance reachable by Saturn over the migration of Titan, with amplitudes down to 10−8. Each resonant angle is of the form σj = ψ + ϕj where ϕj has frequency νj labelled on the graph according to its index in the orbital series (see Table 2). For a given value of Titan’s semi-major axis, the interval of obliquity enclosed by the separatrix is shown in pink. The centre of the resonance (i.e. Cassini state 2) with ϕ3 is shown by a red line and the upper and lower separatrices are highlighted in blue. The ridge line a = rF dividing the close-in and far-away satellite regimes is represented by a dashed blue line. The region E1 where the satellite’s Laplace state P1 is unstable isshown in black. The singular point S1 is shown by a red dot.
Current usage metrics show cumulative count of Article Views (full-text article views including HTML views, PDF and ePub downloads, according to the available data) and Abstracts Views on Vision4Press platform.
Data correspond to usage on the plateform after 2015. The current usage metrics is available 48-96 hours after online publication and is updated daily on week days.
Initial download of the metrics may take a while.