Fig. 1
Download original image
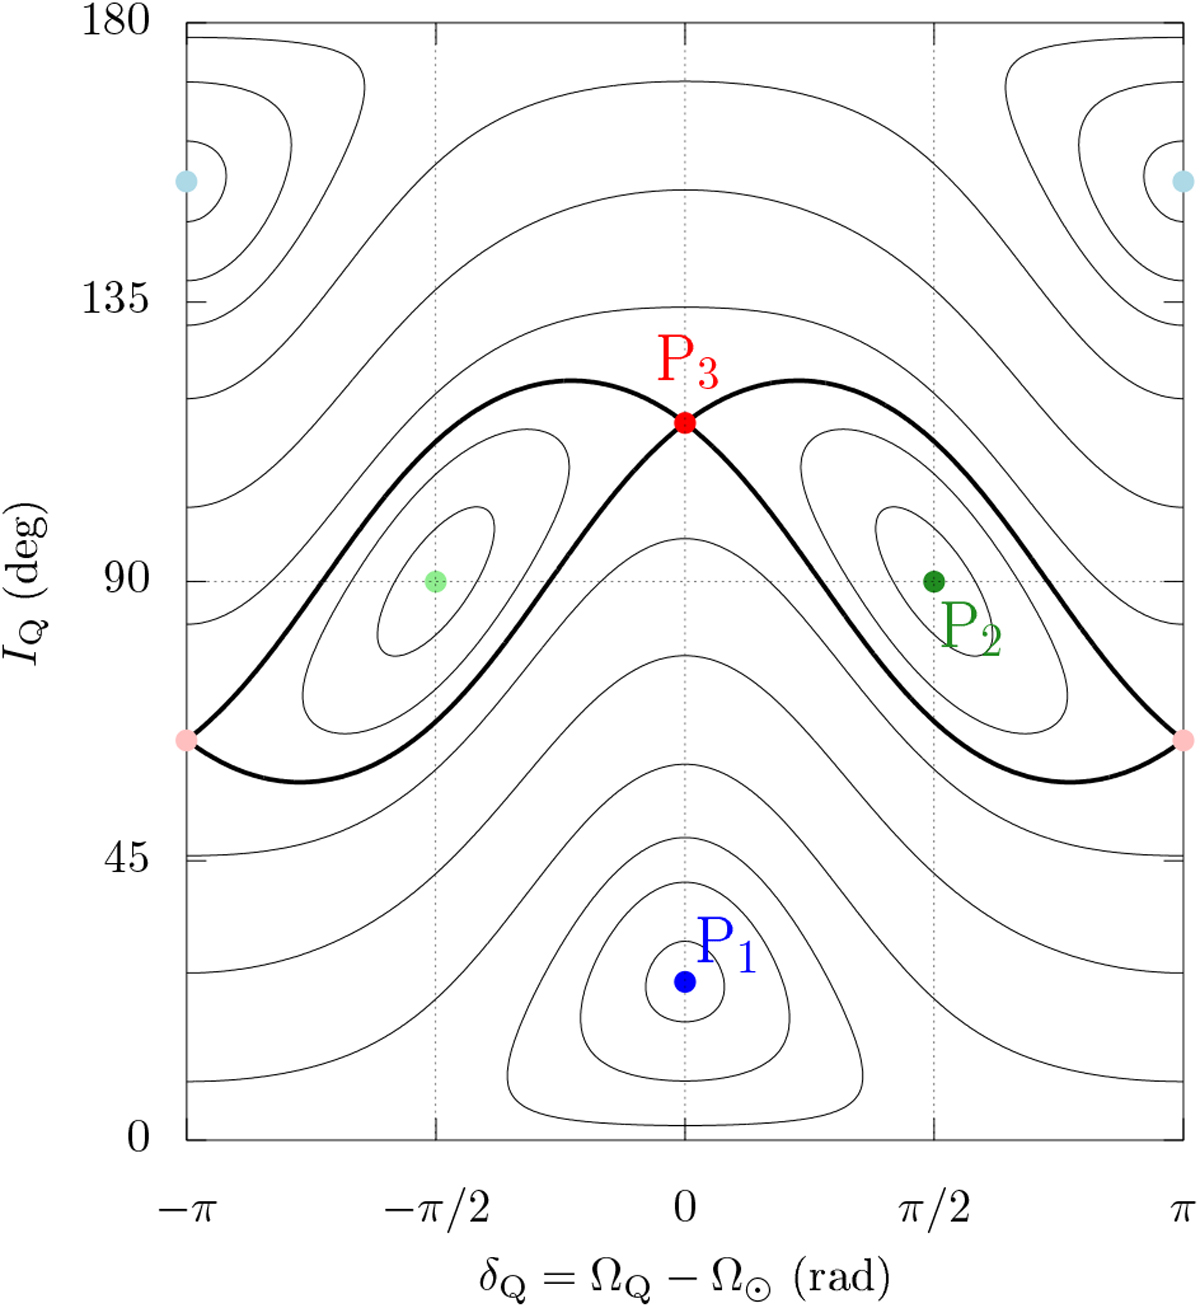
Level curves of the Hamiltonian function ![]() for a circularorbit. The parameters are a∕rM = 1.1 and ε = 40°. The separatrix is shown by a thicker black curve. The coloured dots represent the three kinds of equilibrium points (‘Laplace states’), labelled as in the text. A dark colour is used for points P1 and P3 lying at δQ = 0 and for P2 lying at δQ = π∕2. A light colour is used for the symmetric equilibrium point that corresponds to the same Laplace state with reversed orbital motion. Figure 2a shows the same phase portrait plotted on the sphere.
for a circularorbit. The parameters are a∕rM = 1.1 and ε = 40°. The separatrix is shown by a thicker black curve. The coloured dots represent the three kinds of equilibrium points (‘Laplace states’), labelled as in the text. A dark colour is used for points P1 and P3 lying at δQ = 0 and for P2 lying at δQ = π∕2. A light colour is used for the symmetric equilibrium point that corresponds to the same Laplace state with reversed orbital motion. Figure 2a shows the same phase portrait plotted on the sphere.
Current usage metrics show cumulative count of Article Views (full-text article views including HTML views, PDF and ePub downloads, according to the available data) and Abstracts Views on Vision4Press platform.
Data correspond to usage on the plateform after 2015. The current usage metrics is available 48-96 hours after online publication and is updated daily on week days.
Initial download of the metrics may take a while.