Fig. 6.

Download original image
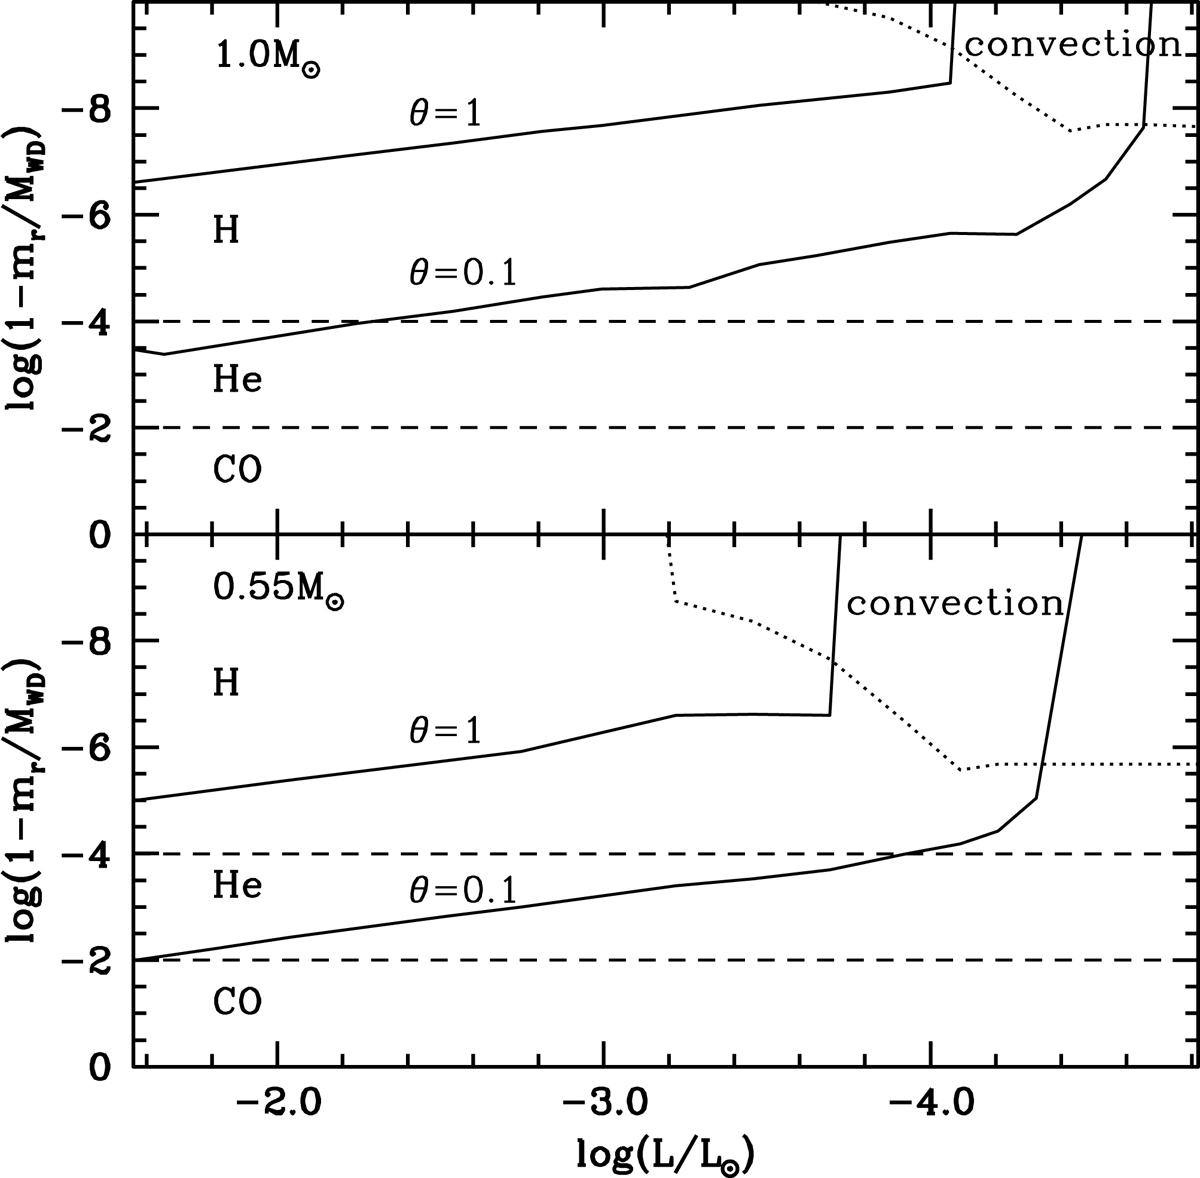
Evolution with the surface luminosity L of selected physical and chemical quantities across WD models with masses equal to 0.55 and 1 M⊙. The vertical axis displays the logarithm of the mass mr enclosed between the surface and a point at a distance r from the centre, normalised to the total WD mass MWD. Dashed lines mark the boundaries of the carbon-oxygen core as well as the helium and the hydrogen envelope. The lower boundary of surface convection is denoted by dotted lines. The solid lines show the position of the mass layers where θ = 1 and 0.1.
Current usage metrics show cumulative count of Article Views (full-text article views including HTML views, PDF and ePub downloads, according to the available data) and Abstracts Views on Vision4Press platform.
Data correspond to usage on the plateform after 2015. The current usage metrics is available 48-96 hours after online publication and is updated daily on week days.
Initial download of the metrics may take a while.


