Fig. 3.
Download original image
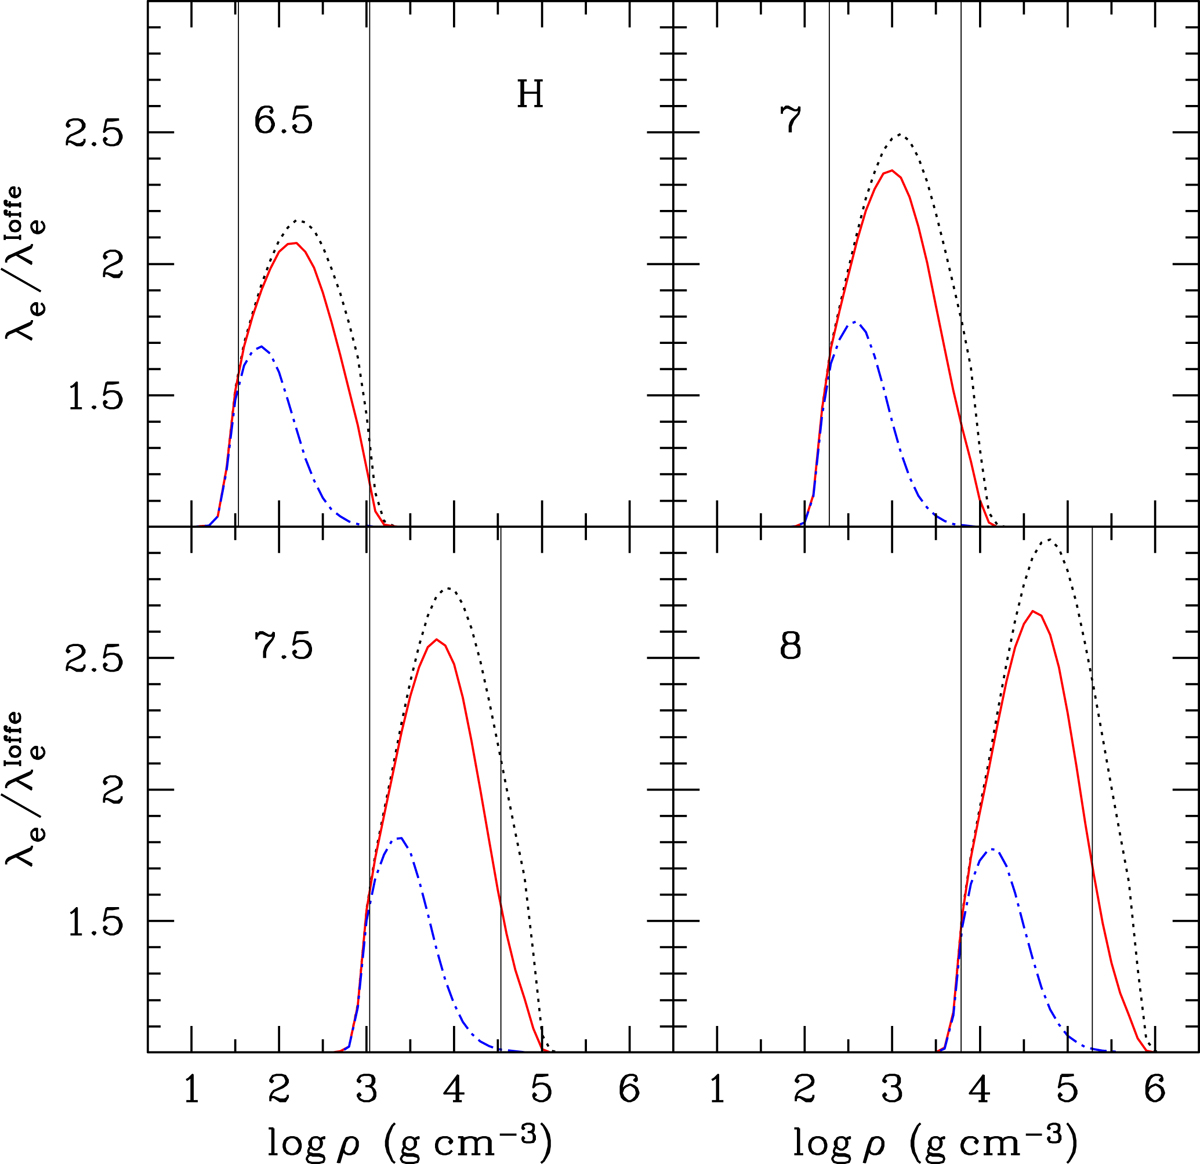
Ratio of the electron thermal conductivity for hydrogen enhanced according to B20 (![]() ) to
) to ![]() results, as a function of log ρ (dotted lines), for the labelled values of log T, with T given in Kelvin. Solid lines display the analogous ratio for the thermal conductivities
results, as a function of log ρ (dotted lines), for the labelled values of log T, with T given in Kelvin. Solid lines display the analogous ratio for the thermal conductivities ![]() obtained using the weakly damped enhancement factor F. Dot-dashed lines show the corresponding ratio for the strong damping,
obtained using the weakly damped enhancement factor F. Dot-dashed lines show the corresponding ratio for the strong damping, ![]() . The vertical lines mark the boundaries of the range of densities corresponding to θ = 1 and θ = 0.1 (higher ρ implies lower θ, at constant T).
. The vertical lines mark the boundaries of the range of densities corresponding to θ = 1 and θ = 0.1 (higher ρ implies lower θ, at constant T).
Current usage metrics show cumulative count of Article Views (full-text article views including HTML views, PDF and ePub downloads, according to the available data) and Abstracts Views on Vision4Press platform.
Data correspond to usage on the plateform after 2015. The current usage metrics is available 48-96 hours after online publication and is updated daily on week days.
Initial download of the metrics may take a while.