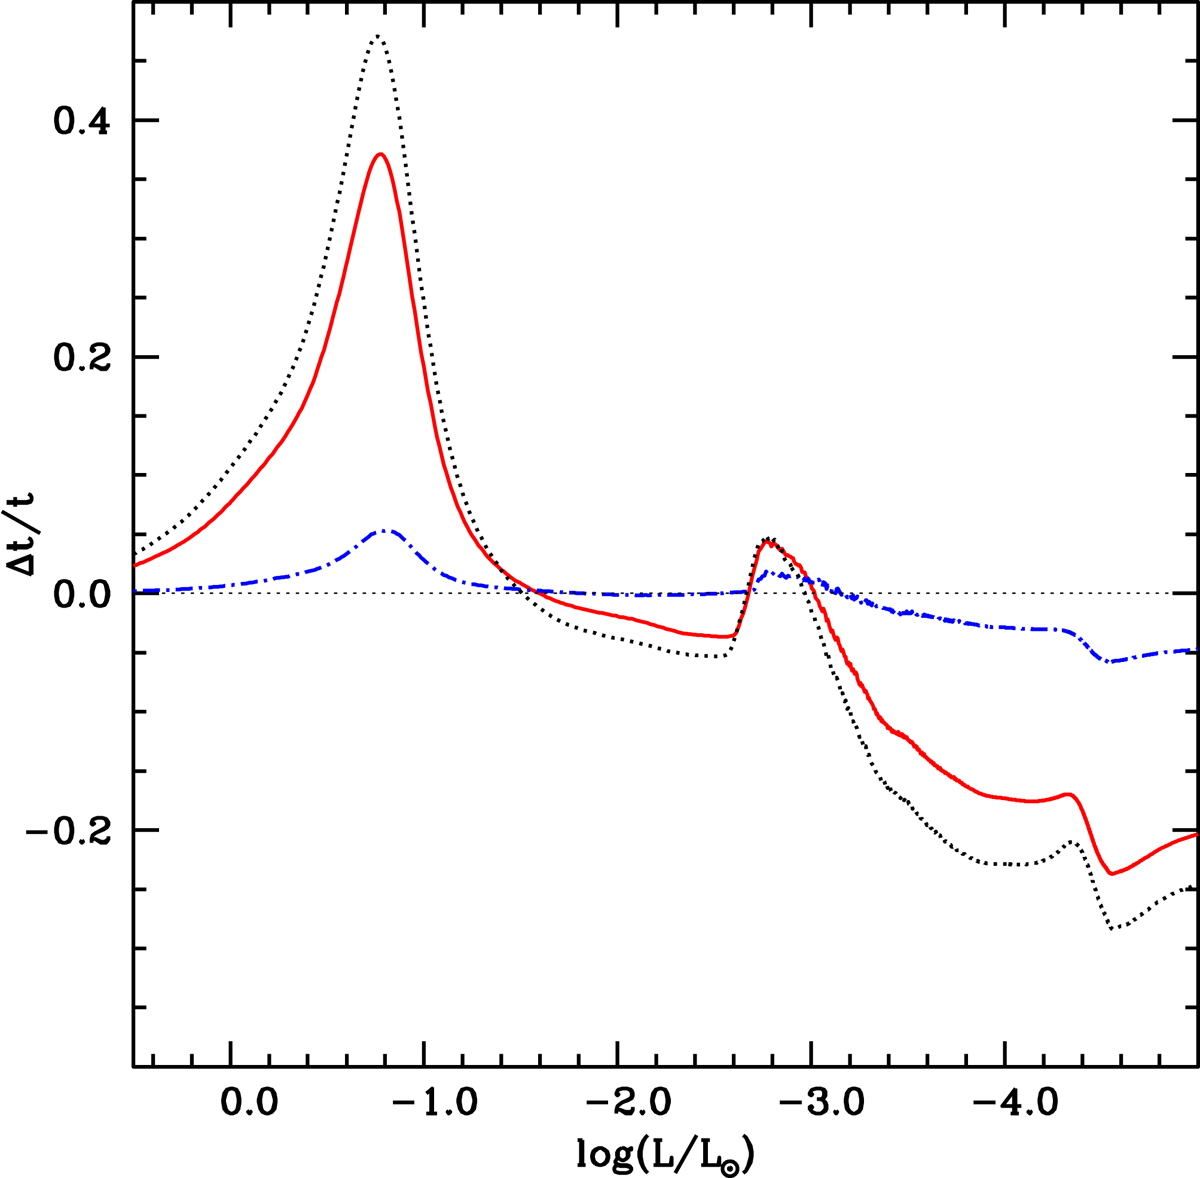
Fig. 10.
Download original image
Relative differences of the cooling times as a function of the surface luminosity, among different evolutionary models of a 1.0 M⊙ DA WD. The dotted line displays the difference between calculations with C07 and B20 opacities (B20 cooling times minus C07 values at the same luminosity), the dot-dashed line the difference between B20sd and C07 calculations, and the solid line the difference between B20wd and C07 models.
Current usage metrics show cumulative count of Article Views (full-text article views including HTML views, PDF and ePub downloads, according to the available data) and Abstracts Views on Vision4Press platform.
Data correspond to usage on the plateform after 2015. The current usage metrics is available 48-96 hours after online publication and is updated daily on week days.
Initial download of the metrics may take a while.