Fig. 1.
Download original image
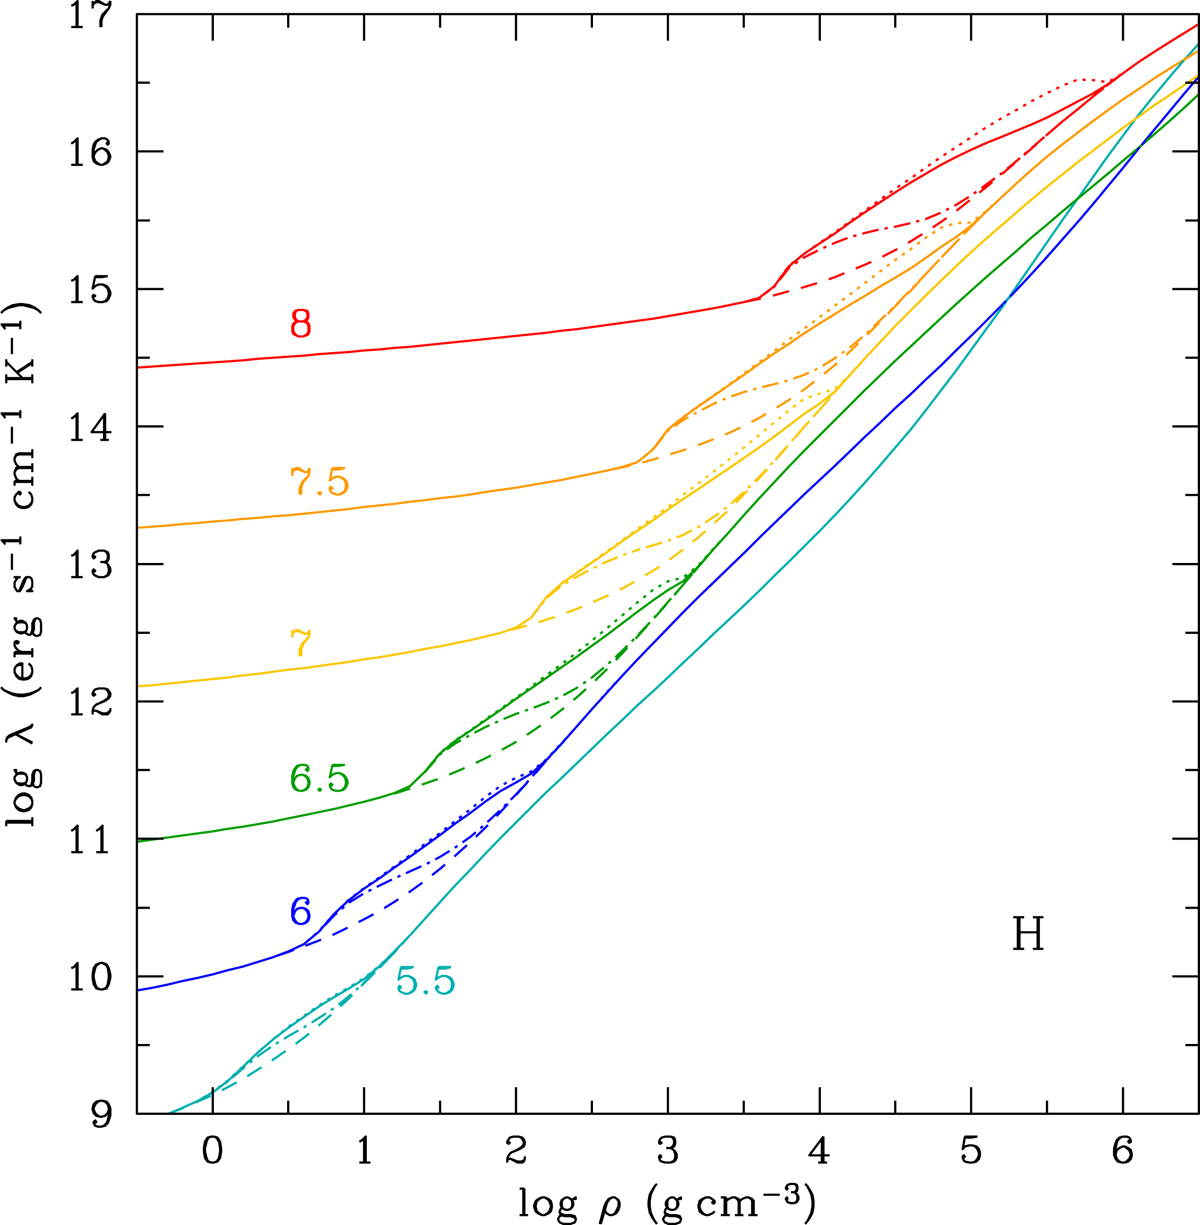
Thermal conductivity for hydrogen as function of mass density for several constant temperatures T. Dashed lines show the traditional conductivities ![]() , and dotted lines display the conductivities
, and dotted lines display the conductivities ![]() enhanced by the F factor in Eq. (11). The solid and dot-dashed lines show the conductivities with the weakly and strongly damped corrections given by Eq. (12),
enhanced by the F factor in Eq. (11). The solid and dot-dashed lines show the conductivities with the weakly and strongly damped corrections given by Eq. (12), ![]() and
and ![]() , respectively. They provide two different transitions from the new calculations for partially degenerate electrons
, respectively. They provide two different transitions from the new calculations for partially degenerate electrons ![]() to the traditional results
to the traditional results ![]() in the strong degeneracy regime (see details in the text). Numbers near the curves mark log T(K) values.
in the strong degeneracy regime (see details in the text). Numbers near the curves mark log T(K) values.
Current usage metrics show cumulative count of Article Views (full-text article views including HTML views, PDF and ePub downloads, according to the available data) and Abstracts Views on Vision4Press platform.
Data correspond to usage on the plateform after 2015. The current usage metrics is available 48-96 hours after online publication and is updated daily on week days.
Initial download of the metrics may take a while.