Fig. 2.
Download original image
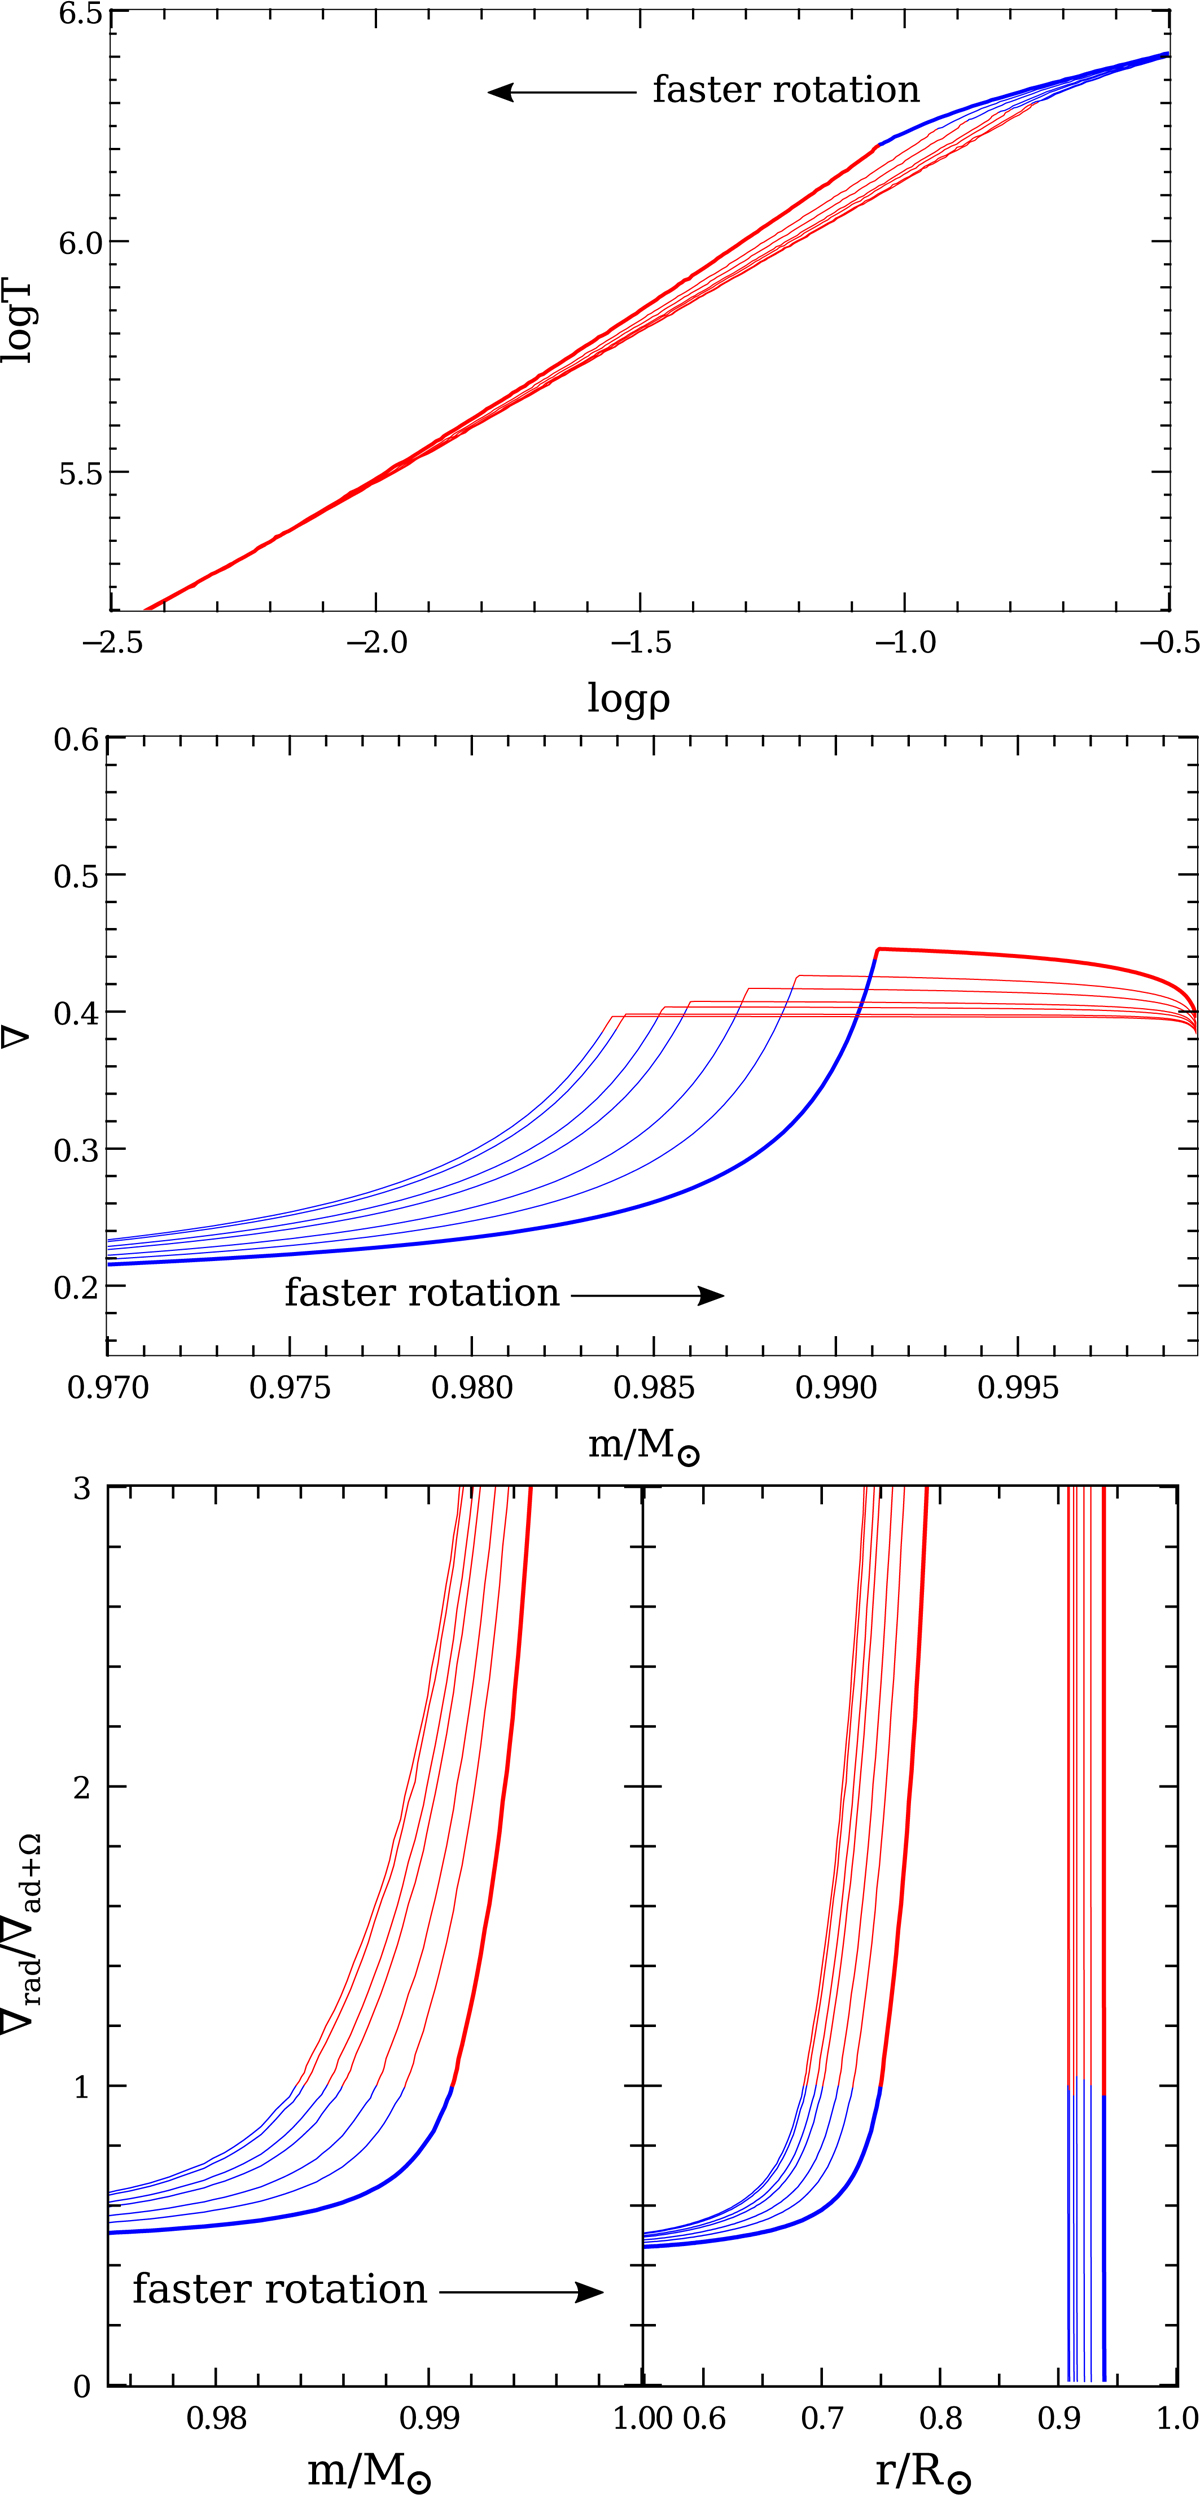
Internal structures from the suite of 1 M⊙ main-sequence models with different rotation rates (0 ≤ Ω ≤ 0.5ΩK) shown in Table 1. Upper panel: temperature and density profiles near the bottom of the convective envelope. The models towards the left-hand side are the fastest rotators. Middle panel: temperature gradient ![]() for the same models. The curves that reach the highest ∇ are the fastest rotators and the fastest is denoted by a thick line. Lower panel: ratio of the temperature gradients as a function of enclosed mass and radial coordinate. The denominator in the ratio of the temperature gradients ∇ad + Ω is the right-hand side of inequality (11) instead of the true adiabatic temperature gradient ∇ad. The requirement for convective instability in the models with rotation is ∇rad/∇ad + Ω > 1. The curves furthest to the right are the fastest rotators and the fastest is denoted by a thick line. Convectively unstable regions are shown in red and stable regions in blue.
for the same models. The curves that reach the highest ∇ are the fastest rotators and the fastest is denoted by a thick line. Lower panel: ratio of the temperature gradients as a function of enclosed mass and radial coordinate. The denominator in the ratio of the temperature gradients ∇ad + Ω is the right-hand side of inequality (11) instead of the true adiabatic temperature gradient ∇ad. The requirement for convective instability in the models with rotation is ∇rad/∇ad + Ω > 1. The curves furthest to the right are the fastest rotators and the fastest is denoted by a thick line. Convectively unstable regions are shown in red and stable regions in blue.
Current usage metrics show cumulative count of Article Views (full-text article views including HTML views, PDF and ePub downloads, according to the available data) and Abstracts Views on Vision4Press platform.
Data correspond to usage on the plateform after 2015. The current usage metrics is available 48-96 hours after online publication and is updated daily on week days.
Initial download of the metrics may take a while.