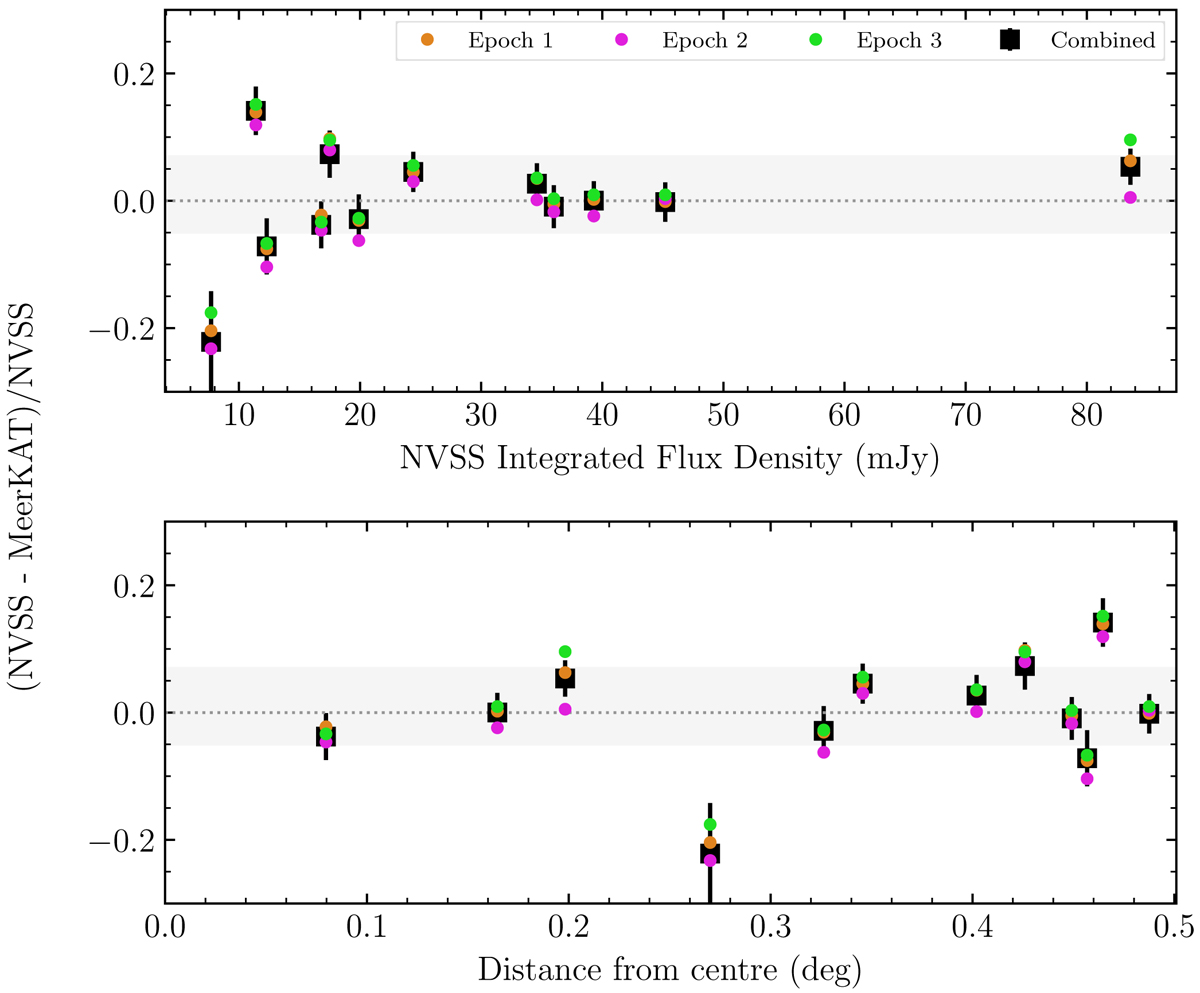
Fig. 2.
Download original image
Comparison between the integrated fluxes from NVSS and MeerKAT (1300–1520 MHz) for 12 sources unresolved by NVSS. Top: the fractional difference as a function of NVSS integrated flux density. Bottom: fractional difference as a function of radius from the centre of the pointing. The light grey horizontal band in each panel indicates the standard deviation of the differences.
Current usage metrics show cumulative count of Article Views (full-text article views including HTML views, PDF and ePub downloads, according to the available data) and Abstracts Views on Vision4Press platform.
Data correspond to usage on the plateform after 2015. The current usage metrics is available 48-96 hours after online publication and is updated daily on week days.
Initial download of the metrics may take a while.