Fig. 3.
Download original image
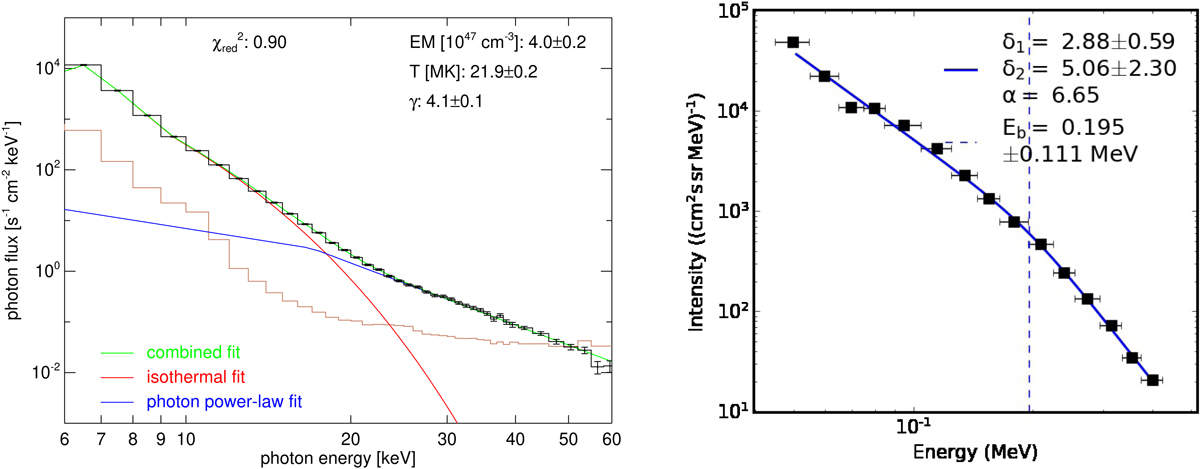
Left: background-subtracted RHESSI photon flux spectrum (black) of the flare of 2011 Mar 24 fitted with an isothermal component (red) and a nonthermal photon power-law (blue). The spectrum was derived using all RHESSI detectors except for number 2 and 3. For comparison, the pre-event background (brown) is plotted as well. The fit results for emission measure EM, temperature T, and spectral index γ are indicated. Right: background-subtracted in situ electron spectrum of the 2011 Mar 24 event. The spectrum is constructed by the peak intensities of each energy channel (marked by circles in the top panel of Fig. 2). The line represents a broken-power law fit to the data.
Current usage metrics show cumulative count of Article Views (full-text article views including HTML views, PDF and ePub downloads, according to the available data) and Abstracts Views on Vision4Press platform.
Data correspond to usage on the plateform after 2015. The current usage metrics is available 48-96 hours after online publication and is updated daily on week days.
Initial download of the metrics may take a while.