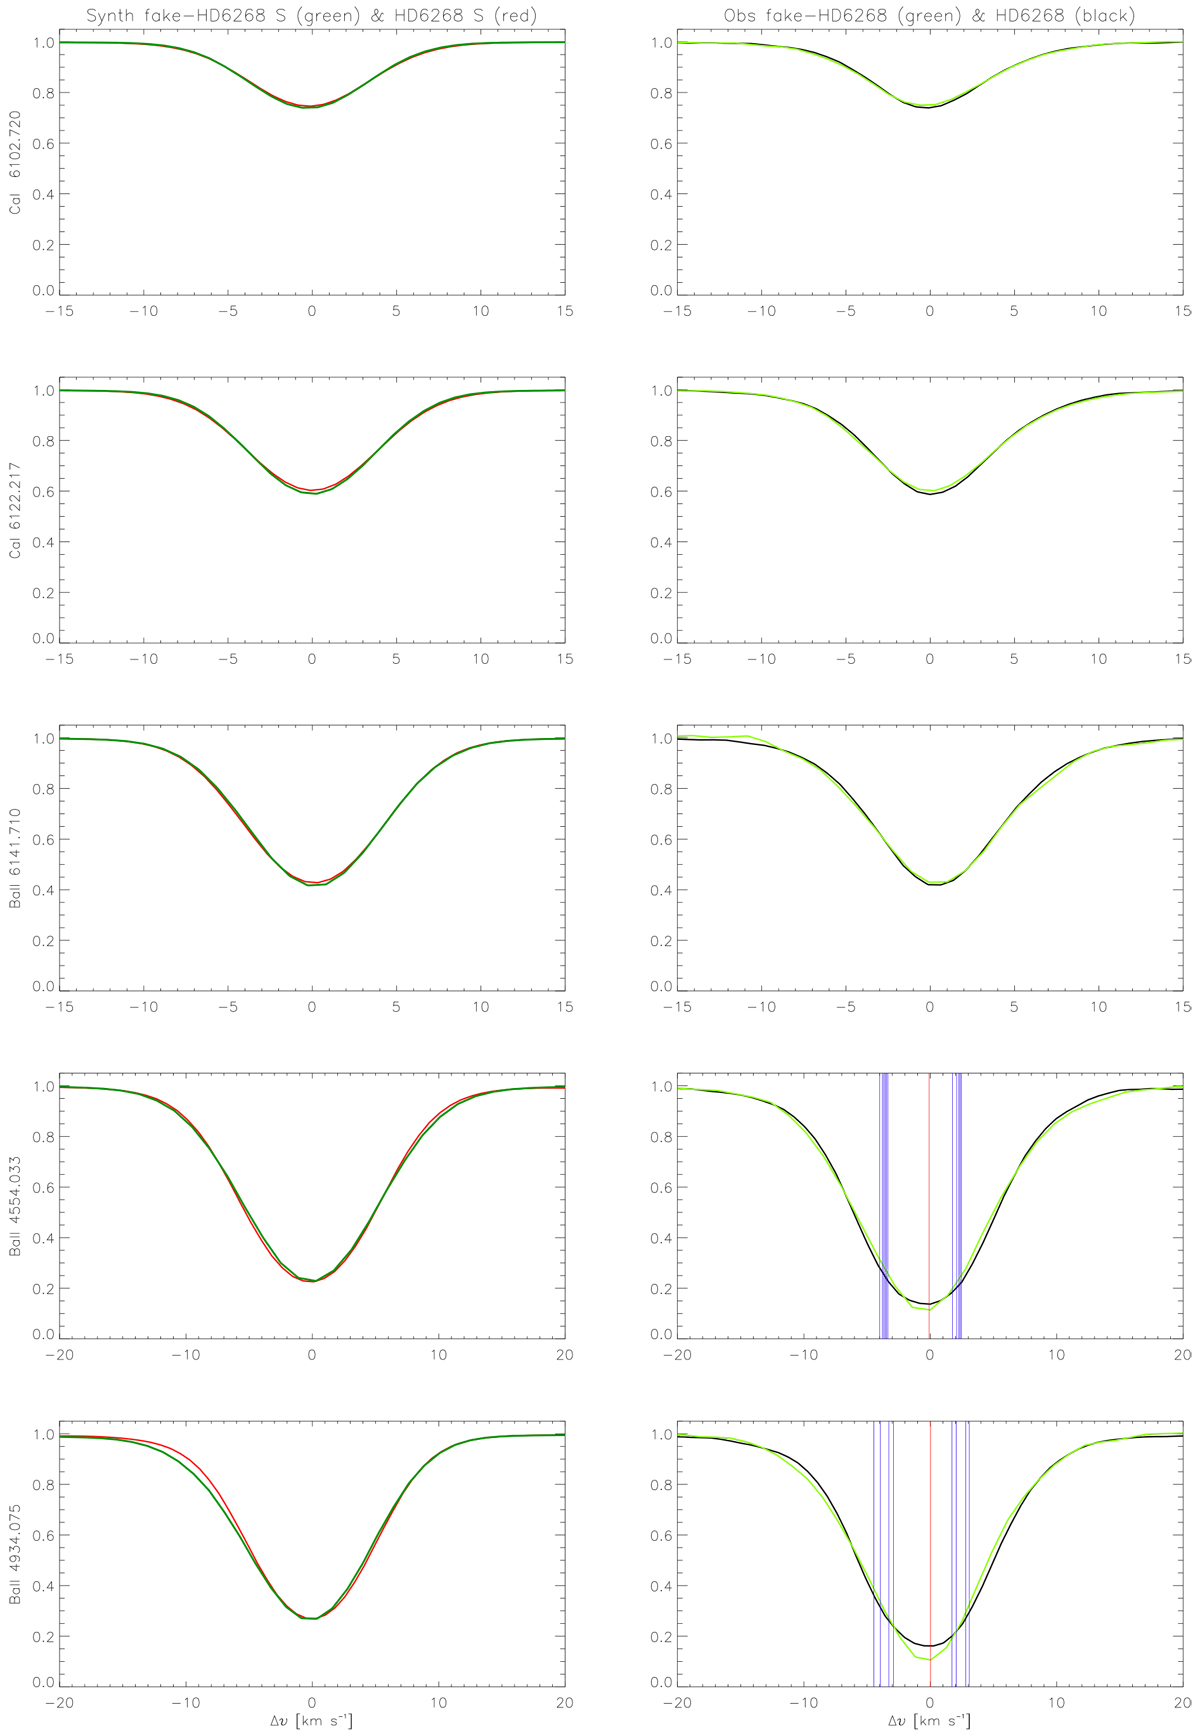
Fig. 9
Download original image
Left panels: comparison of synthetic pure-s profiles of a scaled fake-HD 6268 star (dark green) with those of HD 6268 (red). Right panels: comparison of scaled ‘observed’ profiles of a fake-HD 6268 (light green) with the observed ones of HD 6268 (black) (see text). Vertical blue lines show the hfs lines of odd Ba isotopes, and vertical red lines show lines of the even Ba isotopes.
Current usage metrics show cumulative count of Article Views (full-text article views including HTML views, PDF and ePub downloads, according to the available data) and Abstracts Views on Vision4Press platform.
Data correspond to usage on the plateform after 2015. The current usage metrics is available 48-96 hours after online publication and is updated daily on week days.
Initial download of the metrics may take a while.