Fig. 2
Download original image
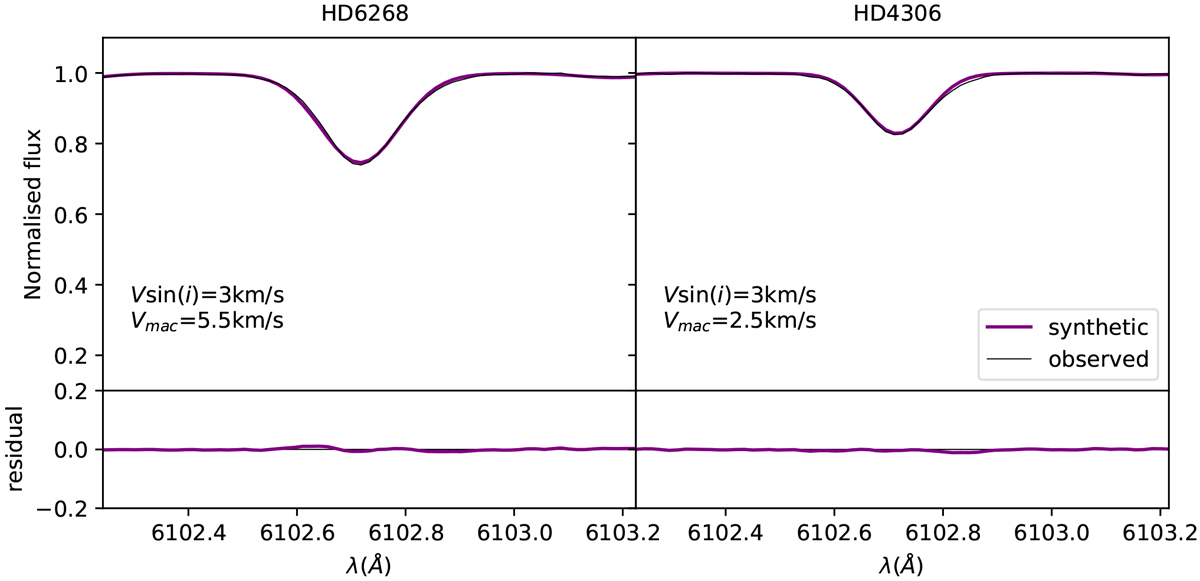
Ca I line at 6102.7 Å. In the upper panels, we show the observed spectra with a black line. The purple lines are the synthetic spectra obtained; in the lower panels, the residuals between synthetic spectra and observed spectra are reported. In the left panels, we present the results for HD 6268, and on the right we show those for HD 4306.
Current usage metrics show cumulative count of Article Views (full-text article views including HTML views, PDF and ePub downloads, according to the available data) and Abstracts Views on Vision4Press platform.
Data correspond to usage on the plateform after 2015. The current usage metrics is available 48-96 hours after online publication and is updated daily on week days.
Initial download of the metrics may take a while.