Fig. 3
Download original image
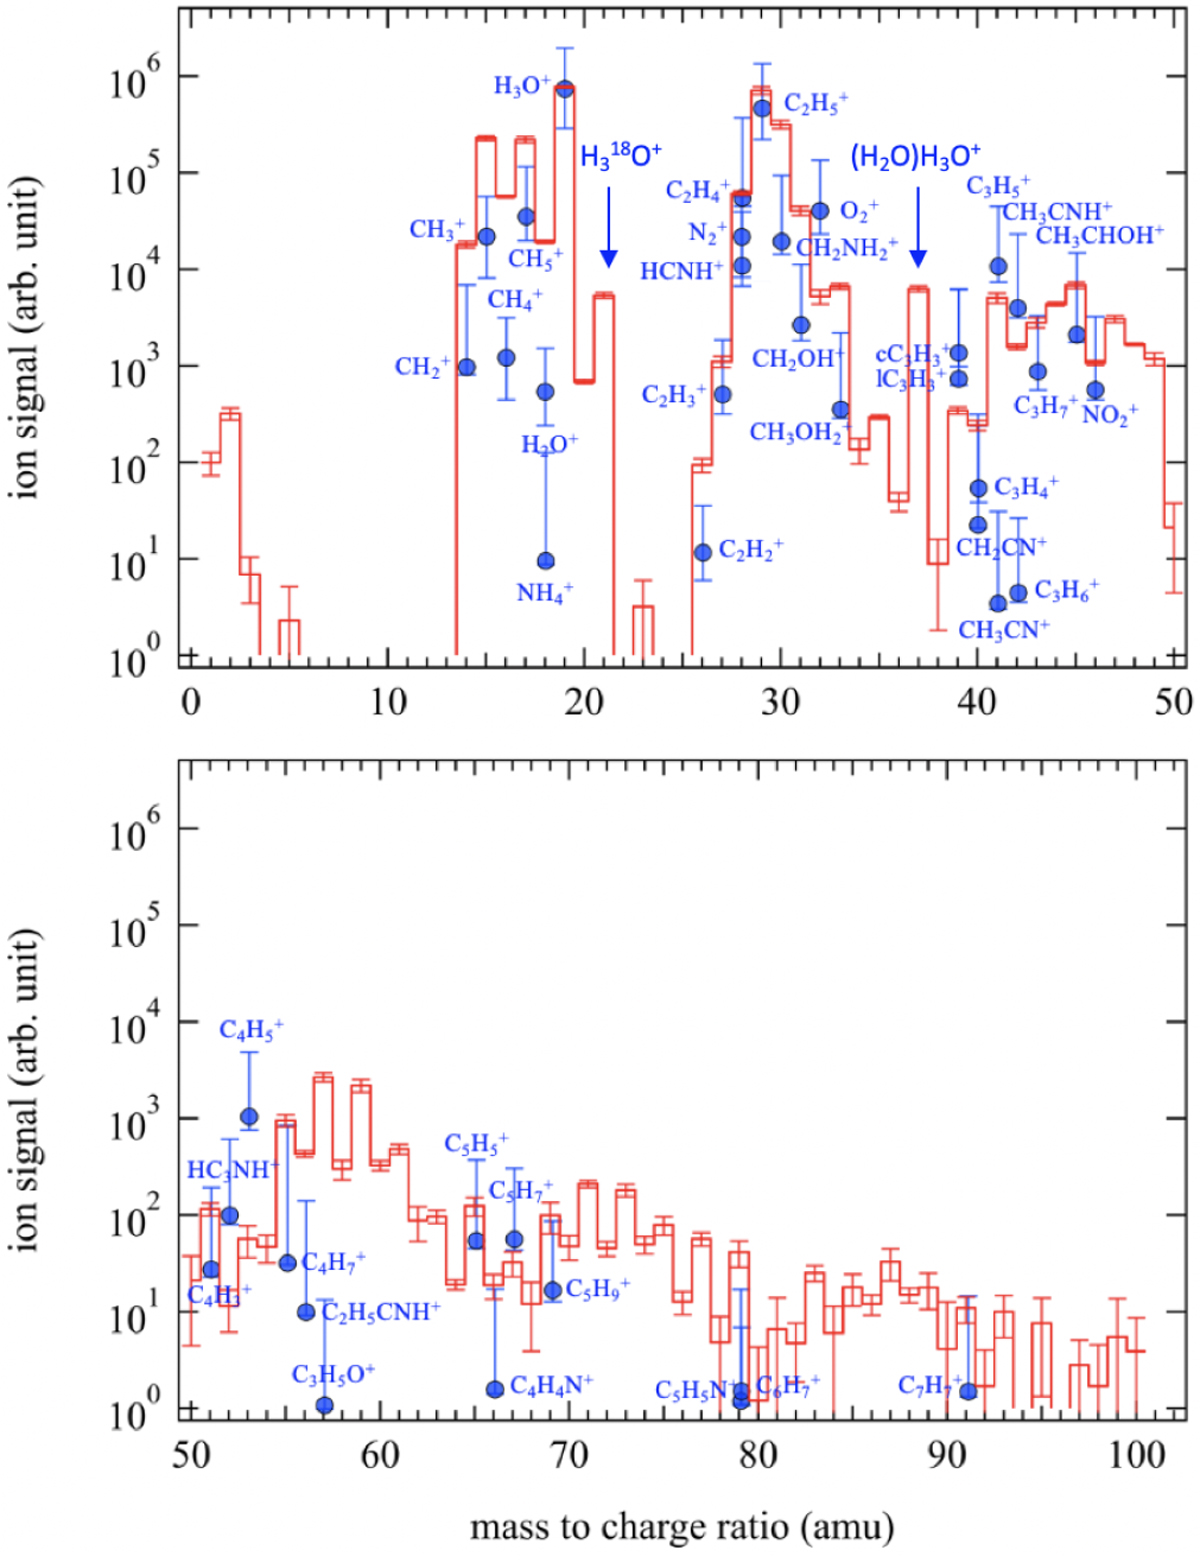
Upper panel: m∕z spectrum up to m∕z 50. The names of the main ions as predicted by the photochemical model, and their relative abundance is symbolized by the blue dots. Lower panel: m∕z spectrum from m∕z 50 to m∕z 100. Thenames of the main ions as predicted by the photochemical model, and their relative abundance is symbolized by the blue dots. Experimental and numerical data are scaled to m/z 29. The uncertainties on both experimental and numerical predictions are given as boxplots at a 2σ confidence interval.
Current usage metrics show cumulative count of Article Views (full-text article views including HTML views, PDF and ePub downloads, according to the available data) and Abstracts Views on Vision4Press platform.
Data correspond to usage on the plateform after 2015. The current usage metrics is available 48-96 hours after online publication and is updated daily on week days.
Initial download of the metrics may take a while.