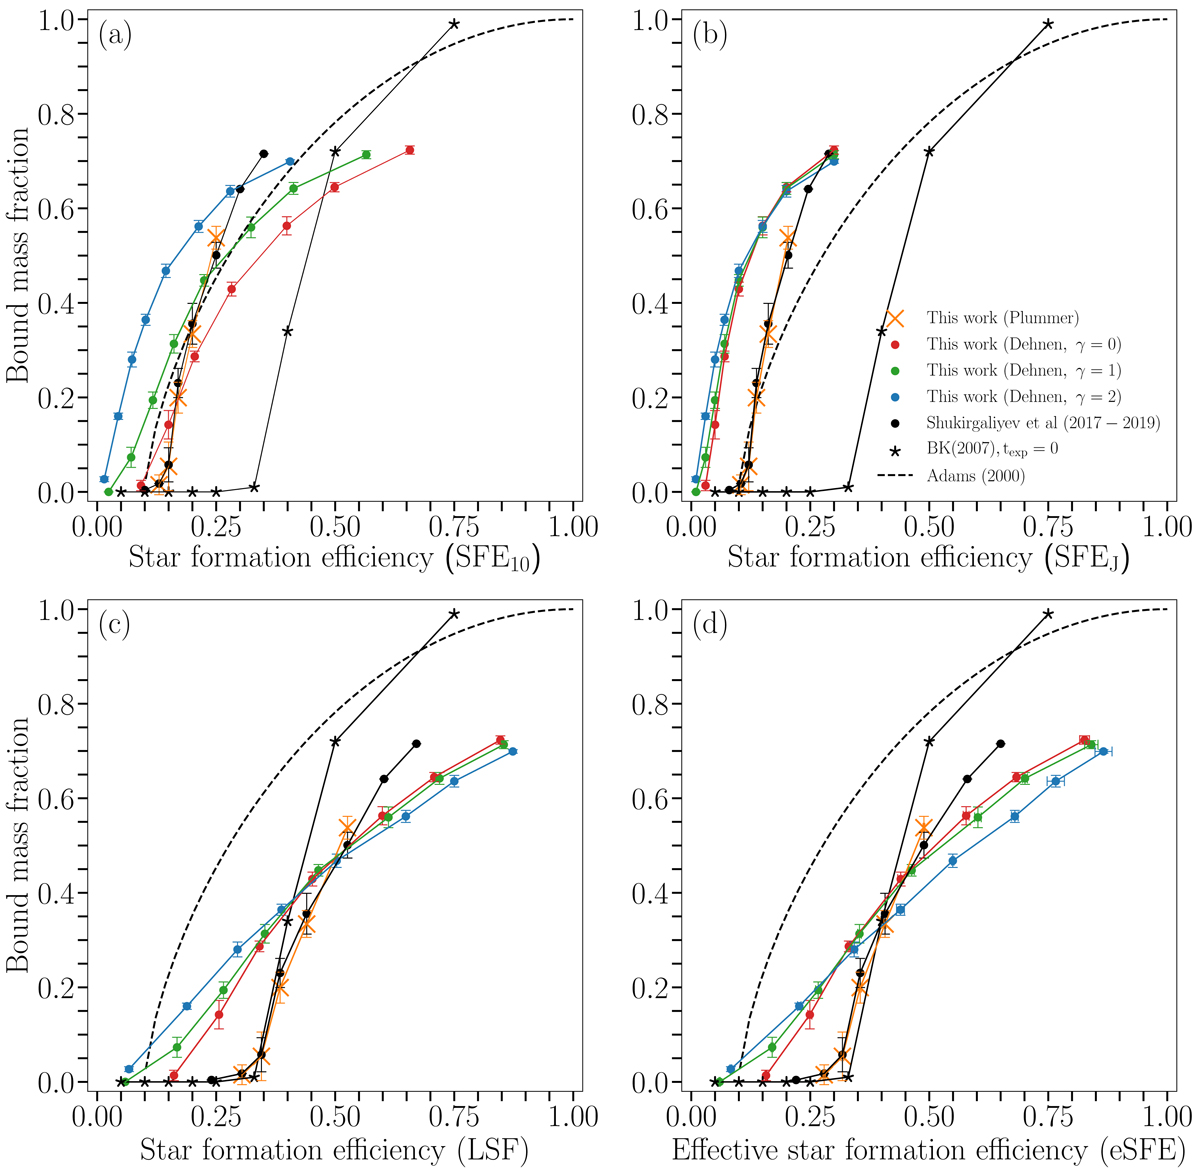
Fig. 9.
Download original image
SFE and bound mass fraction at the end of violent relaxation (t = tVR) for the Dehnen models (γ = 0, 1, 2 in red, green and blue points) and the Plummer model (orange crosses). The points correspond to the mean bound mass fraction of all random realizations of one model cluster, and error-bars correspond to the respective standard deviations. There are four different measurements of SFE considered in this plot. Panel a corresponds to SFE measured within ten scale radii corresponding to the models, namely, SFE10 = SFEr(10a⋆) as it was measured in Shukirgaliyev et al. (2017). Panel b presents SFE measured within the Jacobi radius, SFE_J = SFEr(RJ ≡ 20rh). Panels c and d present the survivability of model clusters as a functions of LSF and eSFE. The black crosses correspond to the default model of Shukirgaliyev et al. (2017, 2019), where the SNe remnant kick velocity is neglected. The results of Adams (2000) (dashes black line) and Baumgardt & Kroupa (2007) (black star symbols, the instantaneous expulsion case only) are plotted for the reference as given in the original publications. For the case of Baumgardt & Kroupa (2007), SFEs measured in all different ways are identical because the density profiles of gas and stars have the same shapes.
Current usage metrics show cumulative count of Article Views (full-text article views including HTML views, PDF and ePub downloads, according to the available data) and Abstracts Views on Vision4Press platform.
Data correspond to usage on the plateform after 2015. The current usage metrics is available 48-96 hours after online publication and is updated daily on week days.
Initial download of the metrics may take a while.