Fig. 8.
Download original image
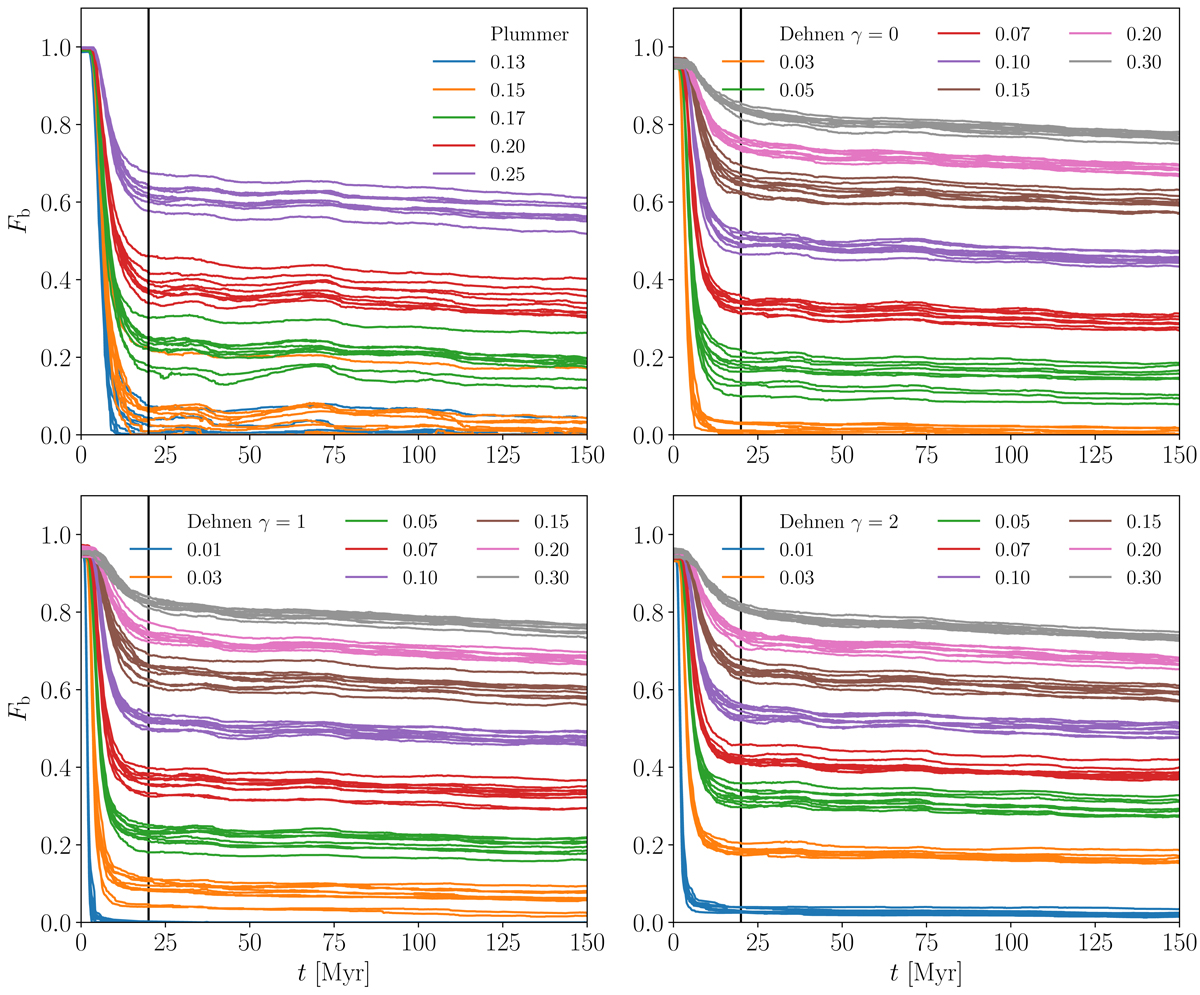
Bound mass fraction evolution of clusters corresponding to the Plummer model (upper left panel) and the Dehnen (γ = 0, 1, 2 as indicated in legends) models during the first 150 Myr after instantaneous gas expulsion. The lines are color-coded by the corresponding SFEs as in the key. SFE10 has been used for the Plummer clusters, while SFE_J for the Dehnen clusters, respectively. The adopted end of violent relaxation tVR = 20 Myr is indicated by the vertical black line.
Current usage metrics show cumulative count of Article Views (full-text article views including HTML views, PDF and ePub downloads, according to the available data) and Abstracts Views on Vision4Press platform.
Data correspond to usage on the plateform after 2015. The current usage metrics is available 48-96 hours after online publication and is updated daily on week days.
Initial download of the metrics may take a while.