Fig. 5.
Download original image
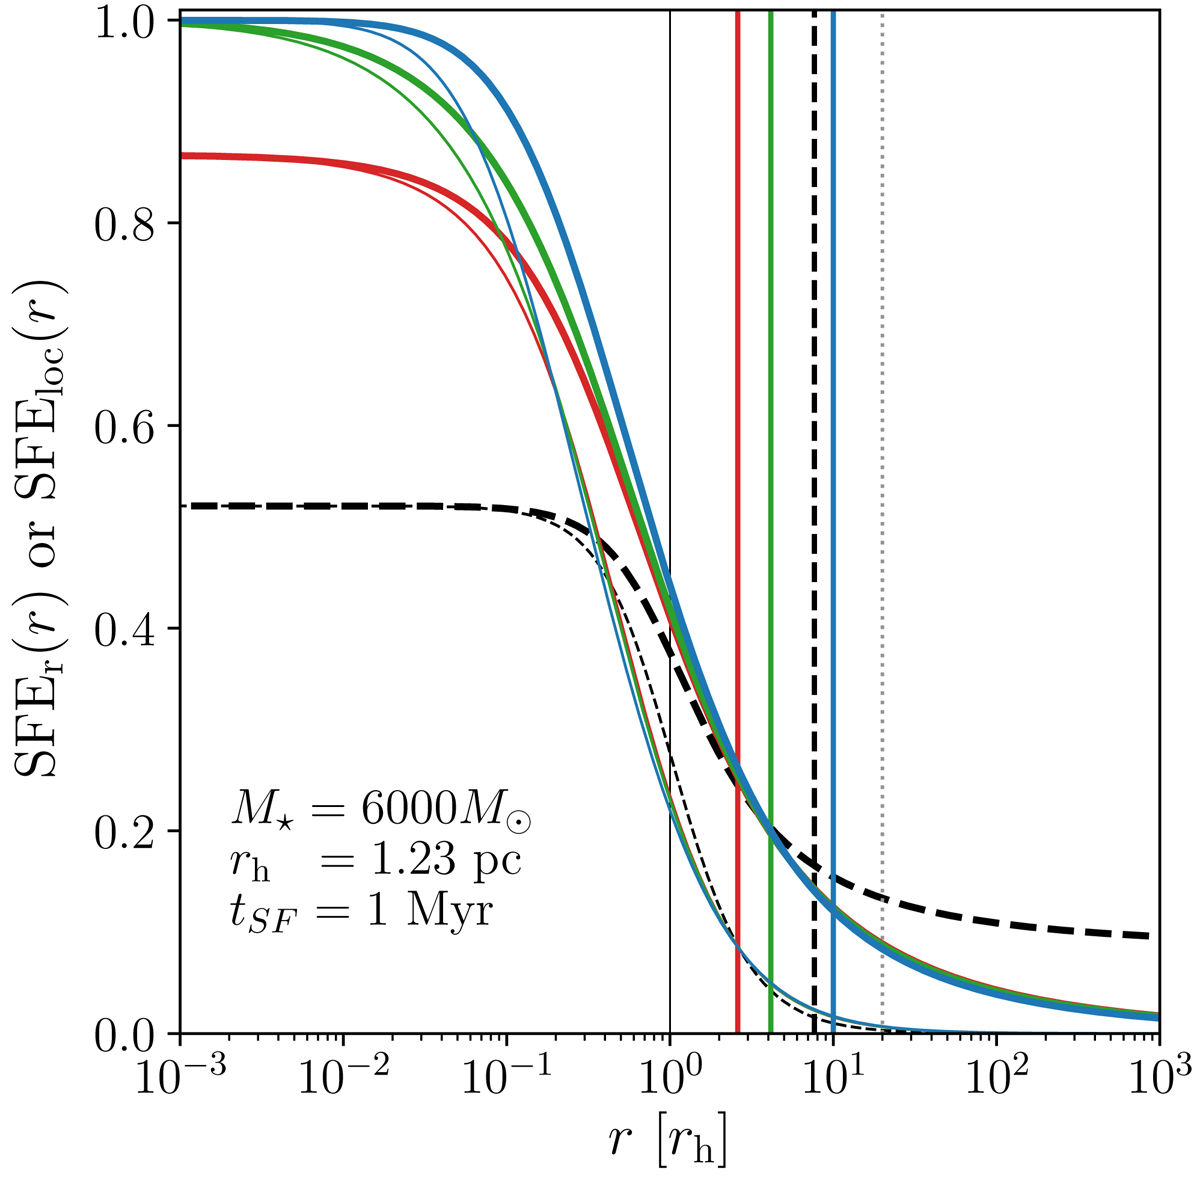
Cumulative and local SFE profiles of model clusters with different stellar density profiles corresponding to the Dehnen model (γ = 0, 1, 2 in red, green, and blue solid lines) and the Plummer model (dashed lines), given in thick and thin lines, respectively. SFE per free-fall time of ϵff = 0.05 and the SF duration of tSF = 1 Myr (or equivalently ϵff = 0.01 and tSF = 5 Myr) were adopted to recover the density profiles of the residual gas for a cluster with M⋆ = 6000ℳ⊙ and rh = 1.23 pc. The vertical lines correspond to the stellar half-mass radius, rh (black solid line), 10aD (red, green, and blue solid lines corresponding to γ = 0, 1 and 2), 10aP (black dashed line), and the Jacobi radius, RJ (black dotted line), respectively.
Current usage metrics show cumulative count of Article Views (full-text article views including HTML views, PDF and ePub downloads, according to the available data) and Abstracts Views on Vision4Press platform.
Data correspond to usage on the plateform after 2015. The current usage metrics is available 48-96 hours after online publication and is updated daily on week days.
Initial download of the metrics may take a while.