Fig. 9.
Download original image
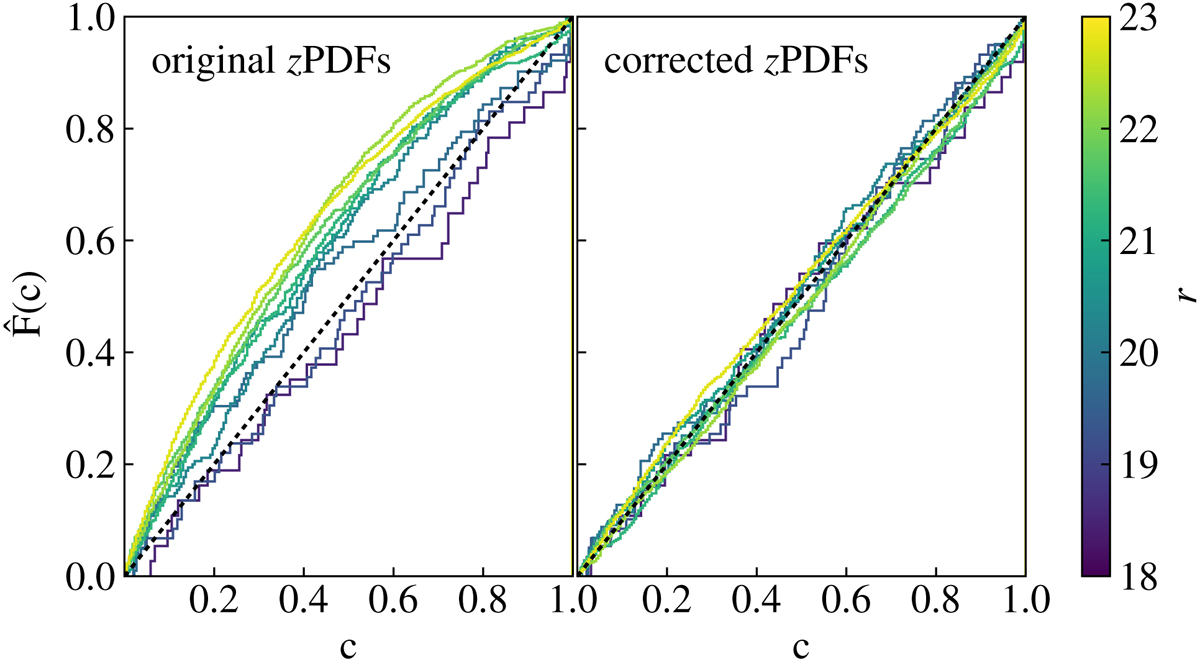
Fraction of galaxies with zspec within the highest probability density confidence interval as a function of the confidence level before (left) and after (right) the contrast correction of the zPDF. Galaxies are grouped by their r-band flux in bins of 0.5 magnitudes. The diagonal line marks the (c) = c relation that is expected if the zPDF represents the actual redshift uncertainty. Values above (below) this line imply under- (over-)confidence in the zbest estimate.
Current usage metrics show cumulative count of Article Views (full-text article views including HTML views, PDF and ePub downloads, according to the available data) and Abstracts Views on Vision4Press platform.
Data correspond to usage on the plateform after 2015. The current usage metrics is available 48-96 hours after online publication and is updated daily on week days.
Initial download of the metrics may take a while.