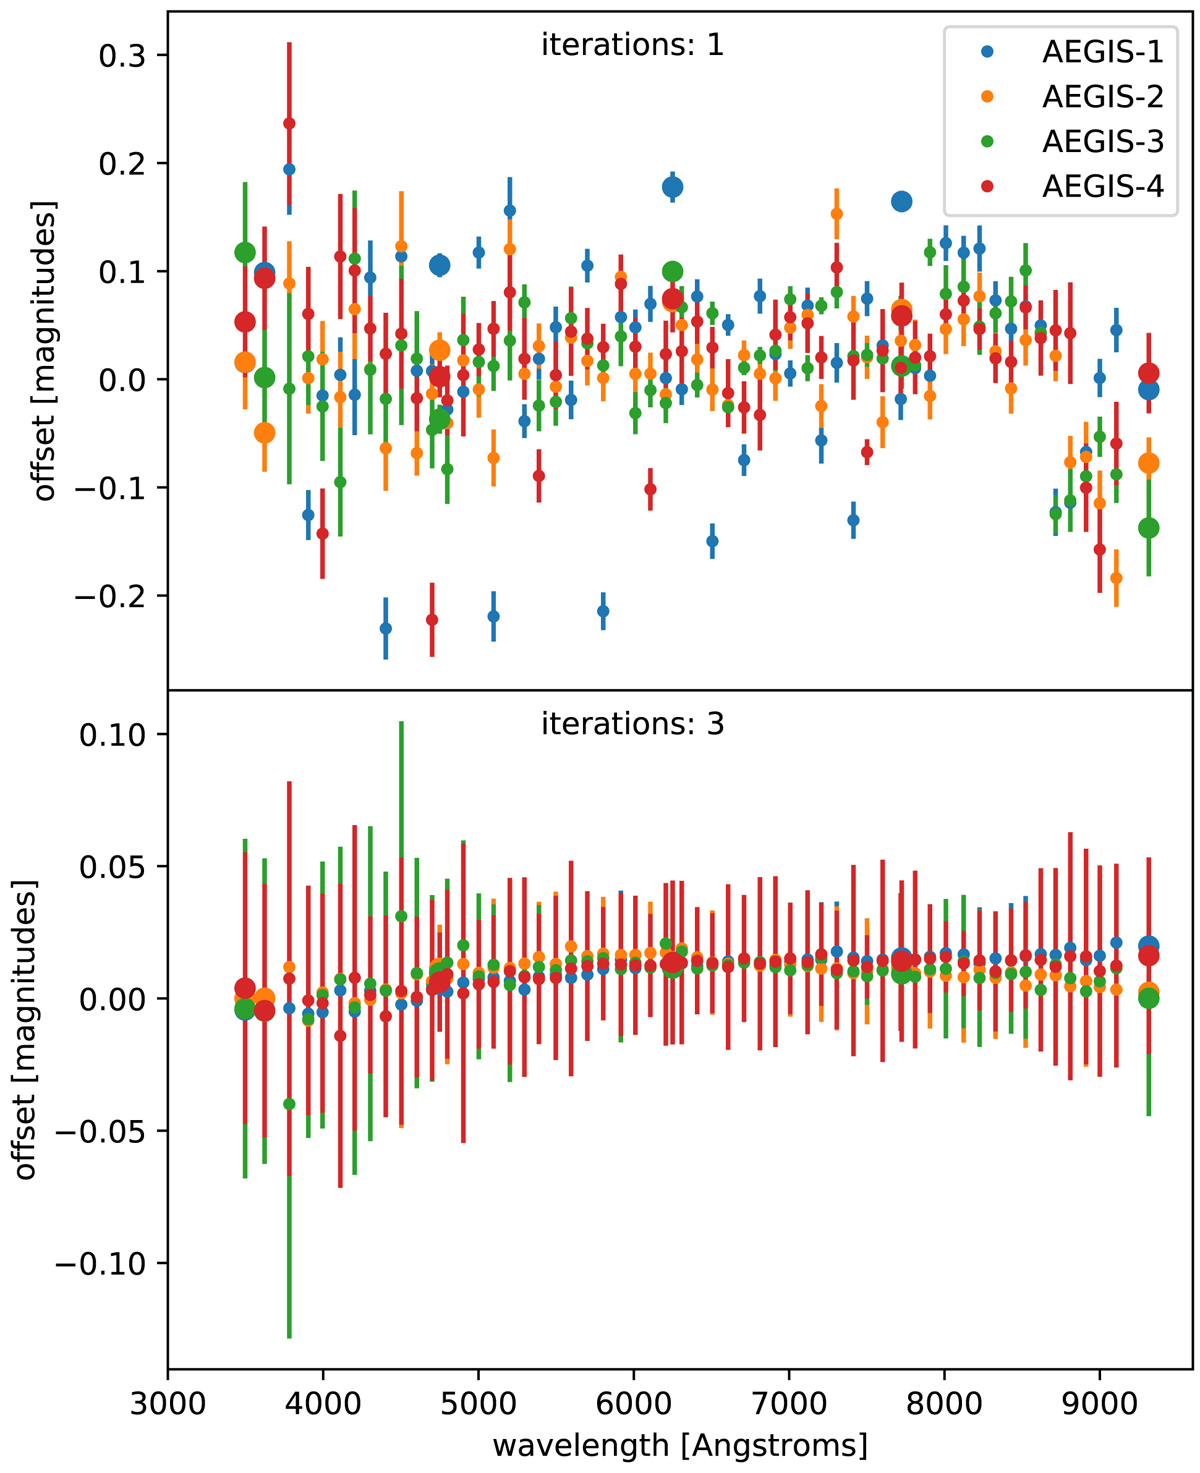
Fig. 5.
Download original image
Magnitude residuals between the observed and synthetic photometry after the first (top) and third (bottom) iterations of the recalibration procedure. Symbols indicate the median residual, and error bars enclose the 16th to 84th percentile ranges. Small symbols correspond to photometry in the narrow-band J-PAS filters, and large symbols represent broad-band filters (uJAVA, uSDSS, gSDSS, rSDSS, and iSDSS) and the long-pass J1007 filter.
Current usage metrics show cumulative count of Article Views (full-text article views including HTML views, PDF and ePub downloads, according to the available data) and Abstracts Views on Vision4Press platform.
Data correspond to usage on the plateform after 2015. The current usage metrics is available 48-96 hours after online publication and is updated daily on week days.
Initial download of the metrics may take a while.