Free Access
Fig. 4.
Download original image
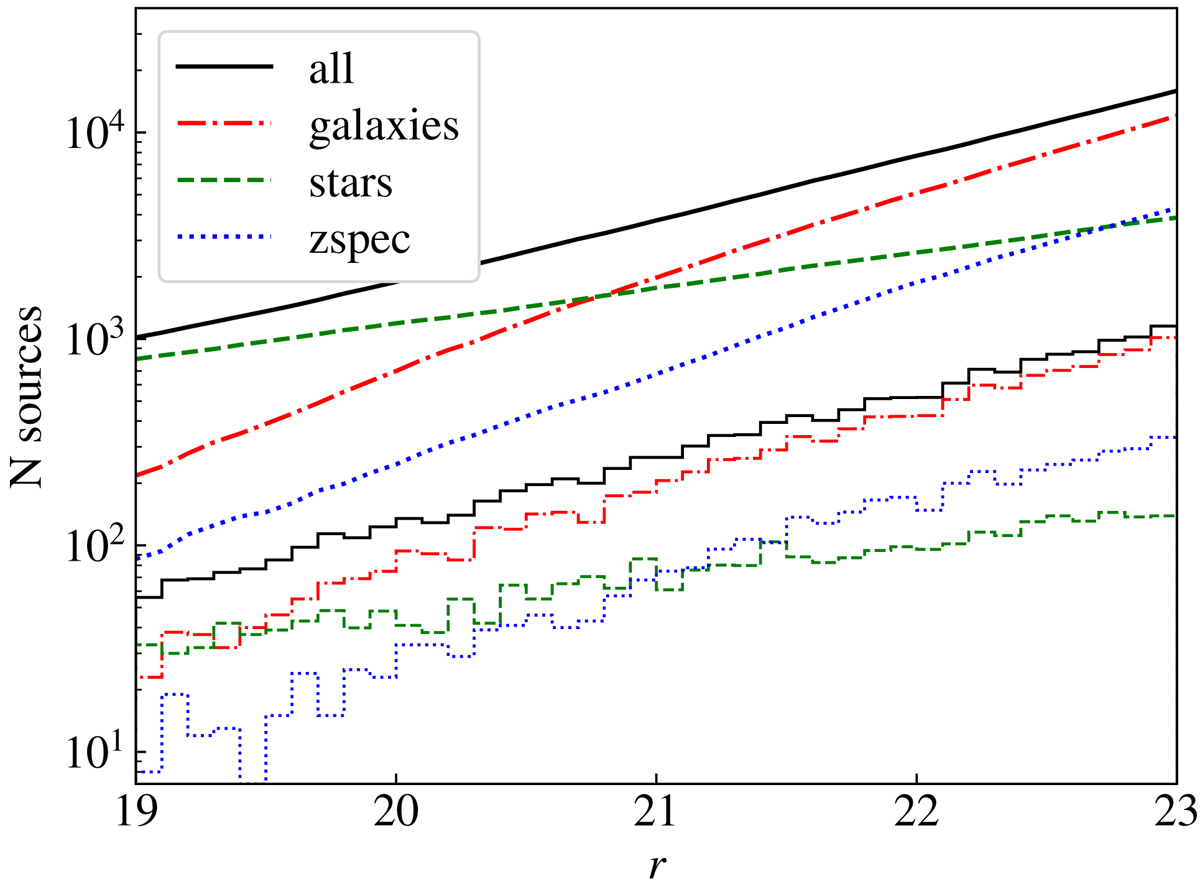
Distribution of miniJPAS sources as a function of r-band magnitude for all sources (solid black lines), stars (dashed green lines), galaxies (dot-dashed red lines), and galaxies with spectroscopic redshifts (dotted blue lines). Smooth lines show cumulative counts, and histograms show counts in bins of 0.1 magnitudes.
Current usage metrics show cumulative count of Article Views (full-text article views including HTML views, PDF and ePub downloads, according to the available data) and Abstracts Views on Vision4Press platform.
Data correspond to usage on the plateform after 2015. The current usage metrics is available 48-96 hours after online publication and is updated daily on week days.
Initial download of the metrics may take a while.